Search for donor segmentation and you will find a dozen guides explaining RFM. They are mostly accurate and mostly written by CRM vendors. What almost none of them tell you is what RFM cannot see, which is the part that decides whether your segmentation actually changes any revenue.
This page covers the model, the four segments worth building first, the specific blind spot in all of them, and what it costs to automate the work. If you are further back than that and want to know which metrics to track at all, our donor analytics guide is the better starting point.
The data work that has to happen first
Segmentation runs on your gift table, so it inherits every problem your gift table has. Three in particular will produce confidently wrong segments, and all three are common enough to check before you score anything.
Duplicate constituent records. A donor who exists twice has their frequency halved and their monetary value split across both records. The effect is systematic rather than random: your most engaged donors, who have given through several channels over several years, are the most likely to be duplicated, so duplicates push exactly the wrong people down the rankings.
Households scored as individuals. If a couple gives from one account but appears as two records, or alternates which name is on the gift, both records look intermittent while the household is perfectly consistent. Decide whether you are segmenting people or giving units, and be consistent about it.
Missing or defaulted gift dates. Imported history frequently lands with the import date rather than the gift date, or with the first of the month where the day was unknown. Recency is the strongest dimension in the model, so a batch of wrong dates does more damage here than anywhere else. Sort by gift date and look at the distribution: an implausible spike on one day is almost always an import artefact.
None of this requires a project. An afternoon of deduplication and a look at the date distribution will tell you whether your file is fit to score. Doing it after you have built segments means redoing the segments.
What RFM actually is
RFM scores every donor on three numbers drawn from your existing gift table. No new data collection, no survey, nothing you do not already hold.
- Recency. Days since the most recent gift. The single strongest predictor of whether someone gives again.
- Frequency. Number of gifts in a defined window, usually the last two to five years.
- Monetary value. Total or average given in that window. Total rewards long relationships, average rewards capacity. They rank your file differently, so pick deliberately.
The usual method is to sort your donors on each dimension, split them into five equal groups, and score each donor 1 to 5 per dimension. A donor who gave last month, gives often, and gives well is a 555. Someone who gave once, three years ago, at $25 is a 111.
Quintiles matter more than they look. Scoring against fixed thresholds rather than against your own file produces segments that are meaningless for your organisation, because a $500 gift is a major gift at one nonprofit and a mid-level gift at another. Always split against your own distribution.
The four segments worth building before anything else
You do not need all 125 combinations. Four groups carry most of the value, and each has a different obvious action.
- Champions, high on all three. Small group, large share of revenue. The action is stewardship and, for a subset, a conversation about a larger or planned gift. The mistake is treating them as an appeal segment rather than a relationship one.
- Loyal but modest, high frequency and recency, low value. These are your most reliable donors and usually your most under-asked. The action is a considered upgrade ask, not more frequent appeals.
- At risk, previously high frequency, poor recency. Someone who gave three times a year and has not given in fourteen months has not forgotten you, something changed. This is the highest-return segment and the most time-sensitive.
- New, good recency, no frequency yet. A first gift is not a relationship. The action is a defined onboarding sequence, because second-gift conversion is where most retention is won or lost.
Build those four, act on them, and measure the result before adding a fifth. Segmentation schemes tend to grow faster than the capacity to act on them, and a segment nobody works is worse than no segment at all, because it looks like coverage.
Where RFM quietly fails
Here is the part the vendor guides leave out. All three RFM dimensions are computed from completed transactions. Every one of them describes the past. That is fine for describing your file and weak for predicting it.
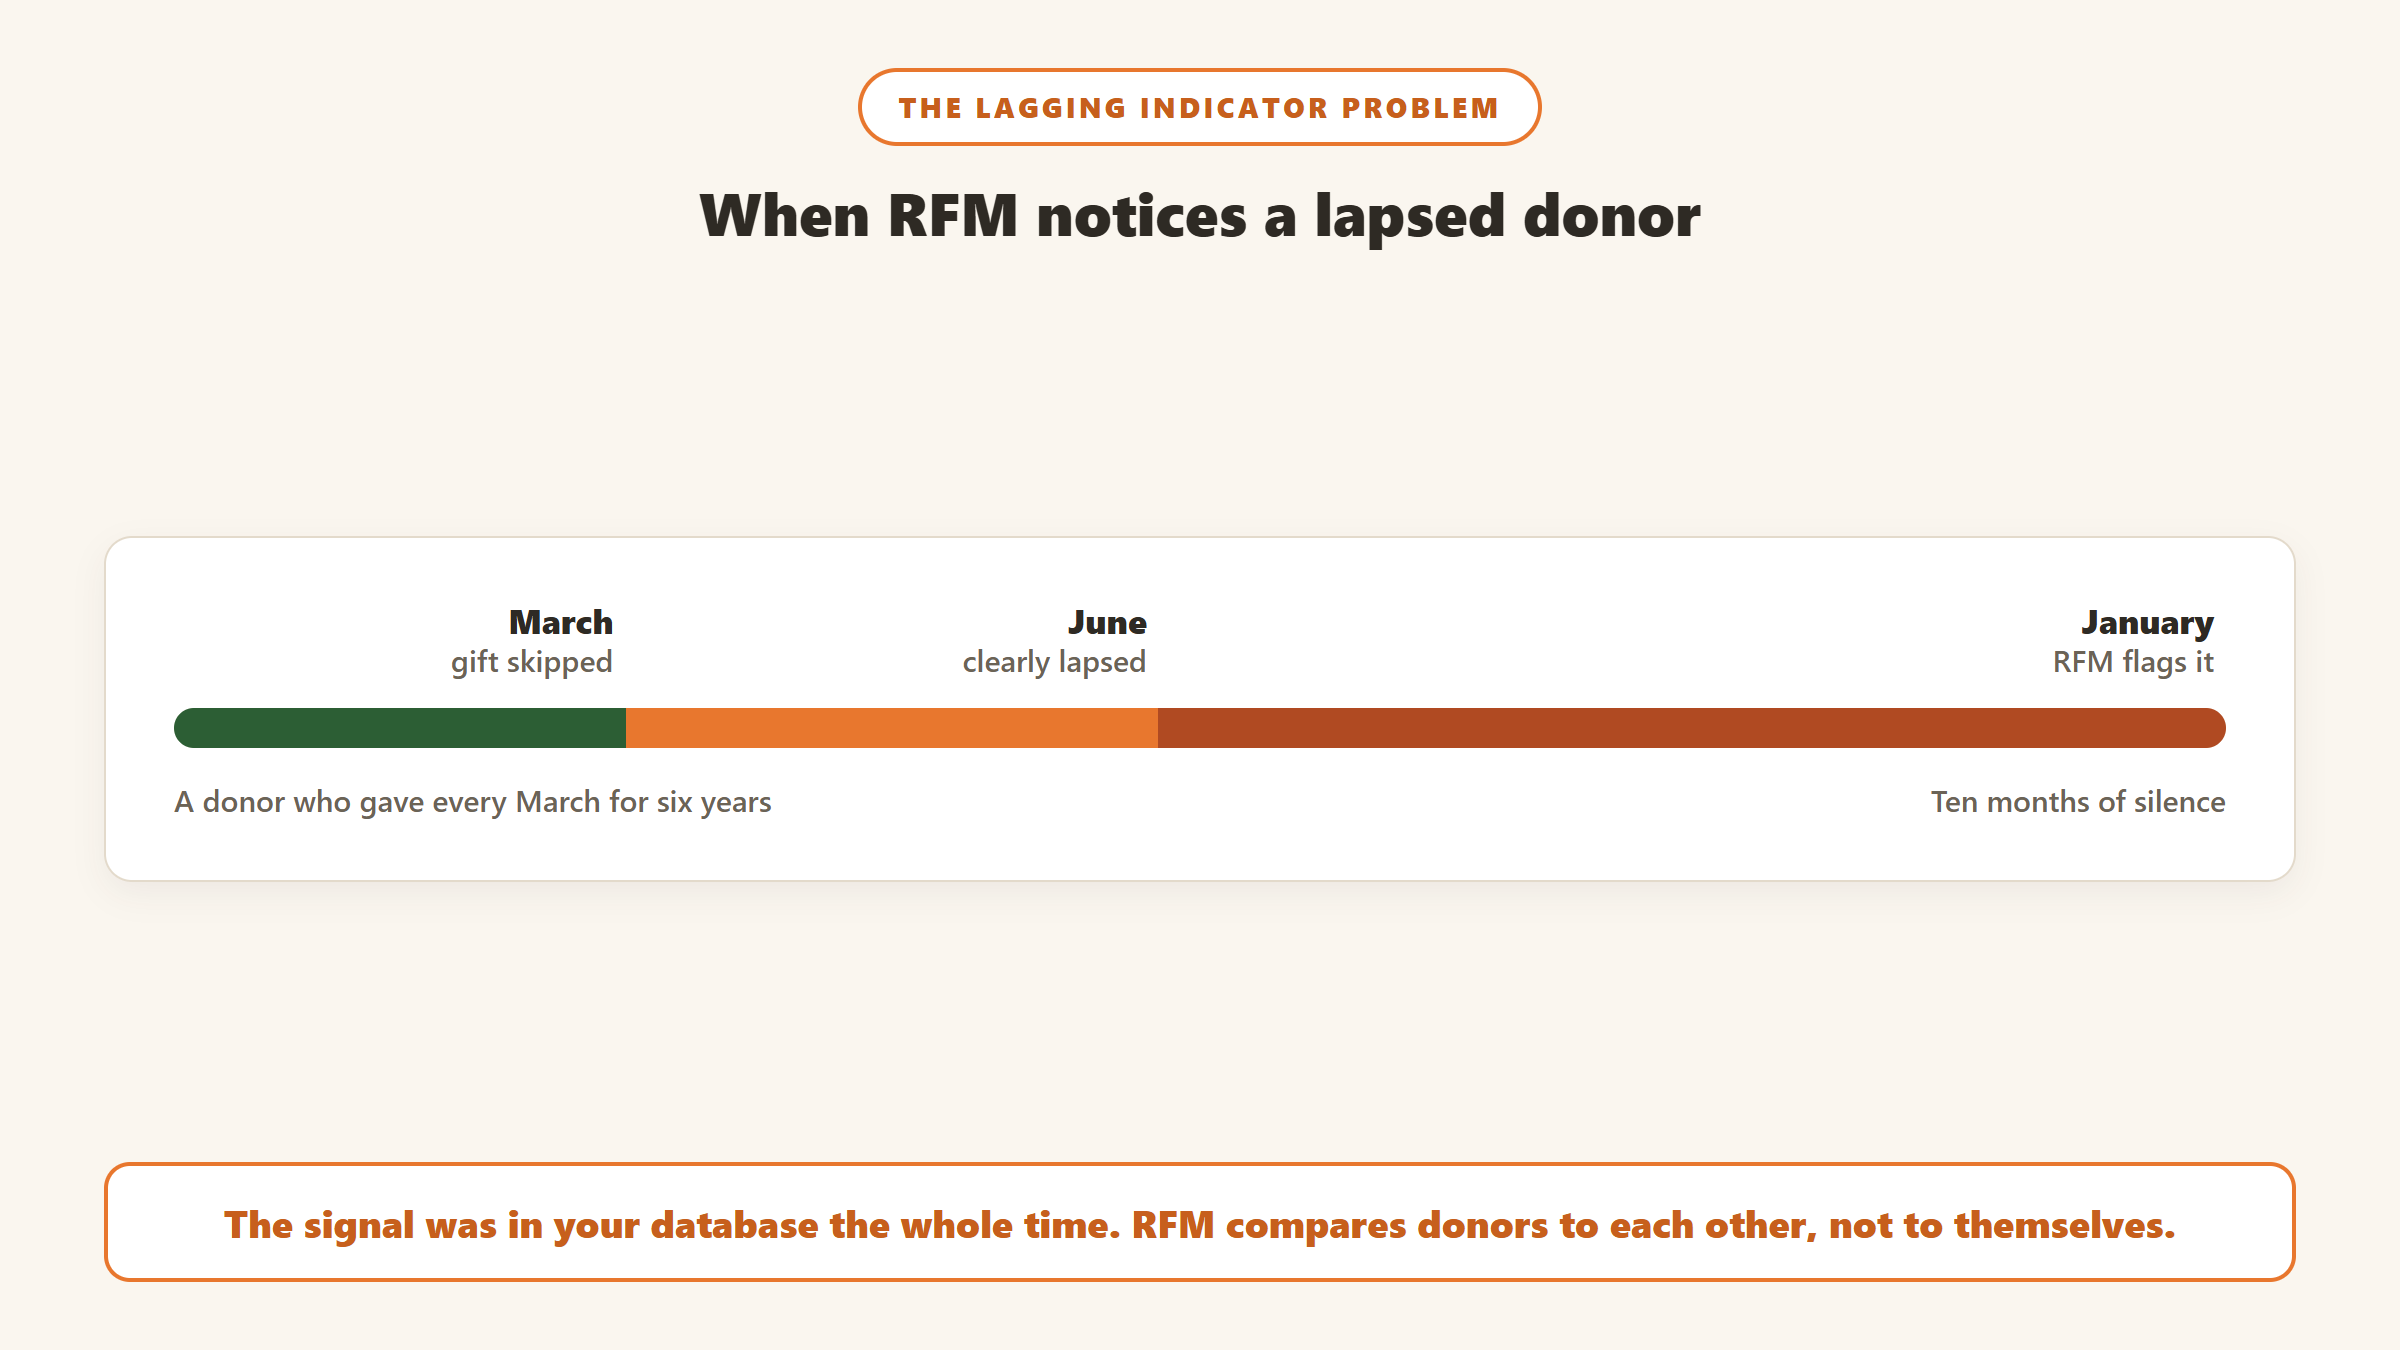
The practical consequence is a timing problem. Consider a donor who gave every March for six years and did not give this March. RFM notices when their recency score decays enough to drop them a quintile, which depending on your file could be months later. By then the reason they stopped, a change of address, a lapsed relationship with a departed staff member, a bad service experience, is months cold and much harder to recover.
A second, subtler failure: RFM has no concept of why. Two donors with an identical 353 score can be completely different people. One is a long-standing supporter of your housing programme who gives when asked and never attends anything. The other came through a colleague’s fundraising page, has no connection to the work, and gave twice out of politeness. Identical scores, opposite strategies. Nothing in recency, frequency or monetary value distinguishes them.
What actually closes those gaps
Three additions, in the order they usually pay off.
Expected timing rather than raw recency. Instead of asking how long since the last gift, ask how long since the last gift relative to this donor’s own pattern. A March donor is late in May. An irregular donor is not late at all in May. This is the single highest-value change to a standard RFM model and it uses data you already have.
Non-transactional signals. Event attendance, email engagement, volunteer hours, a reply to a stewardship note. These lead giving rather than following it, and they usually sit outside the gift table, which is exactly why most segmentation ignores them.
The reason, attached to the record. The hardest and most valuable. Why this person gives, in a form that survives the departure of the person who knew. This is institutional memory, and it is the thing that turns a segment into a conversation.
A worked example of the timing problem
Numbers make this concrete. Take a file where the median gap between gifts is about 200 days, which is typical for an organisation running a spring and an autumn appeal. Split recency into quintiles and the top group is roughly everyone inside 90 days, the second is 90 to 200, and so on.
Now take a donor who has given every March for six years, average gift $250. In April they are 30 days out and sitting in the top recency quintile, scoring 5. In July they are 120 days out and have dropped to a 4, which on most dashboards is still a healthy donor. It is not until roughly the following January, ten months after the gift they skipped, that they fall far enough to appear in anything anyone would call an at-risk list.
Measured against their own pattern, that donor was late in April and clearly lapsed by June. The information was in your database the entire time. RFM simply is not built to read it, because it compares donors against each other rather than against themselves.
Across a file of any size that difference compounds. If a meaningful share of your donors give on personal anniversaries, membership renewals, or a fixed month tied to their own circumstances rather than to your campaign calendar, a pooled recency quintile will systematically flag them late.
What the four segments typically look like by size
People are often surprised by how small the important groups are. On a file of 5,000 active donors, a conventional quintile split produces roughly this shape.
| Segment | Rough share of file | Why it matters | Realistic cadence |
|---|---|---|---|
| Champions | 3 to 8 percent | Concentrated share of total revenue | Individual, not campaign |
| Loyal but modest | 10 to 15 percent | Most reliable and most under-asked | One considered upgrade ask a year |
| At risk | 8 to 12 percent | Recoverable, and decays weekly | Refresh monthly, act within weeks |
| New | Varies with acquisition | Second gift decides retention | Fixed sequence from gift one |
Two things follow from those proportions. First, the group that needs individual human attention is small enough that a team of two or three can genuinely cover it, which is often not believed until the numbers are on the page. Second, the at-risk group is usually larger than the champions group, and it is the one most organisations have no owner for.
These are shapes rather than benchmarks. Your file will differ, particularly if you run heavy acquisition or have a large lapsed population you have not archived. The exercise worth doing is producing this table for your own data before deciding where to spend effort.
Four mistakes that show up repeatedly
Scoring against fixed thresholds instead of your own file. Borrowing another organisation’s definition of a major gift produces segments that describe them, not you.
Letting lapsed donors distort the quintiles. If your file includes everyone who ever gave, including people last seen in 2014, the quintile boundaries shift and your genuinely active donors compress into the top two groups. Define an active window and score inside it.
Segmenting the file but not the ask. Building four segments and sending all of them the same appeal with a different salutation is not segmentation. If the segment does not change the amount, the channel, the sender or the reason, it is a mailing list.
Rebuilding the model instead of working it. Adding dimensions is more interesting than making the calls. Where segmentation fails, the cause is far more often that nobody owned the at-risk list than that the model needed a fourth variable.
Doing it by hand, honestly
You can build a working RFM model in a spreadsheet in an afternoon, and for many organisations that is the correct answer. Export constituent ID, last gift date, gift count and total for a fixed window. Compute days since last gift. Rank each column, split into five, score, concatenate. Filter to the four segments above.
The limitation is not the maths, it is the refresh. A spreadsheet model is a photograph. It is accurate the day you build it and decays from then on, and the at-risk segment, the one where timing matters most, is the one that decays fastest. Teams that do this well rebuild monthly and diarise it. Teams that do it once have a slide, not a programme.
What it costs to automate
If you want segmentation maintained rather than rebuilt, you are buying software. Broadly three categories, and they are priced very differently. Figures read from vendor pricing pages between 4 and 10 September 2026.
| Category | What it does for segmentation | Published entry price |
|---|---|---|
| CRM with built-in segments | Maintains RFM-style groups as saved queries you can mail to | Little Green Light $45/mo, Neon CRM $99/mo, Bloomerang $125/mo, Keela $164/mo |
| Predictive scoring | Trains models on your file to score likelihood to give, lapse or upgrade | Dataro from $15,000/yr plus $0.10 per active donor |
| Donor intelligence layer | Builds segments from records, notes and documents, with the reason cited | Free for one person, then $99/mo |
The gap between the second and third rows is the one to notice. Predictive scoring is a genuinely different product from a CRM segment, and it is priced like enterprise software because it is. If your file is small, a $15,000 floor is not a near-miss on budget, it is the wrong category.
Disclosure: Zilwaris, the consultancy run by AI Tools Bakery’s founder, does paid advisory work for Gratefully. Gratefully did not pay for this placement, and it is assessed on the same criteria as everything else on this site.
The third row is Gratefully, which we rank first in donor intelligence. It is relevant here for one specific reason: it segments on the notes and documents around the gift table as well as the gifts themselves, which is the “why” problem above. As of September 2026 it publishes a free plan covering one person with no record limit, which makes testing this on your own file cost nothing. It is not a CRM and does not replace one.
A note on comparing these on price
Several platforms commonly recommended for segmentation publish no pricing at all, including Virtuous, DonorPerfect and Bonterra. That does not make them wrong, but it does mean you cannot compare them on cost until you have had a sales call, and you cannot forecast the renewal. Our nonprofit CRM pricing census has the full list of who publishes and who does not.
How to tell whether your segmentation is working
The trap is measuring segmentation by outputs. Number of segments built is not a result. Neither is open rate on a segmented email, which mostly measures your subject line.
Three measures that mean something:
- Second-gift conversion rate for the new-donor segment, tracked as a cohort by month of first gift. This is the clearest early signal that onboarding works.
- Reactivation rate in the at-risk segment against a holdout group you deliberately do not contact. Without the holdout you cannot separate your campaign from donors who would have given anyway.
- Average gift movement in the loyal-but-modest segment over a full year. Upgrades are slow and a quarterly read will mislead you in both directions.
The holdout is the one most often skipped and the one that makes the other numbers trustworthy. It feels wasteful to withhold an appeal from a group of lapsing donors. It is the only way to know whether the appeal did anything.
Where to start on Monday
If you have no segmentation at all, build the four segments above in a spreadsheet this week and pick one to act on. The at-risk group is usually the fastest to show a result, because those donors already know you.
If you have RFM already and it is not moving revenue, the problem is more likely action than model. Check whether anyone owns each segment and whether the at-risk list is refreshed monthly or annually. Adding dimensions to a model nobody works will not help.
And if your segments are maintained and worked and the ceiling is that nobody can remember why any of these people give, that is the institutional memory problem, and it is a different purchase from a better model.

Written by
FazFaz is the founder of AIToolsBakery. Some tools here are tested hands on. Others are assessed from vendor documentation and pricing verified on the live page, and every review says which one it is. Sponsors can buy a position in a guide. They cannot buy the score, the criticism, or silence about a better option.
How we test and how we make money →Frequently Asked Questions