The short answer
You cannot measure clicks that never happen, so stop trying. What is left to measure is whether an AI answer used your page as a source, and how often it chose you over everyone else answering the same question.
That second half is the whole game, and almost every guide on this subject skips it. Here is the shape of it:
| What to count | Why | Where to get it free |
|---|---|---|
| Citation share. Your citations on a query as a proportion of all citations on it | The only figure that is not hostage to how many people happened to ask that week | Bing Webmaster Tools, AI Performance |
| Cited page count. How many distinct pages get used | Breadth. Rises when your coverage genuinely improves | Bing Webmaster Tools, AI Performance |
| Impressions without clicks | The closest proxy for being read and not visited | Google Search Console |
| Swings by more than 20x on unchanged content. See below | Do not report this alone |
This page is the measurement companion to our guide to AI search monitoring tools, which covers which tool to buy. This one covers what to do with any of them, and what you can do with no tool at all.
What zero-click search actually is, and what is left to measure
A zero-click search is one where the person gets their answer on the results page or inside an AI assistant and never visits a source. The term predates AI: featured snippets and knowledge panels were doing this years ago. What changed is that an AI answer synthesises several sources into new text, so there is often no single result to click even if the person wanted to.
The thing that is actually being measured
When a click does not happen, three things can still be observed. Whether you appeared. Whether you were used as a source. And whether the answer named you. Those are different events, and tools conflate them constantly. Appearing in the retrieved set is not the same as being cited, and being cited is not the same as being mentioned by name in the visible answer text.
Why the old metrics stop working here
Rank position assumes a list. An AI answer is not a list, and the same question asked twice can be grounded on different sources. Click-through rate assumes a click. Sessions assume a visit. All three are still worth reporting for the traffic you do get, but none of them can see the thing you now care about, which is whether your work is feeding answers you never see.
The famous zero-click statistic does not mean what it is quoted to mean
Before measuring anything, it is worth being precise about the number everyone opens with, because it is routinely used as evidence for a claim it cannot support.
What the study actually counted
The most-cited primary research here is SparkToro’s 2024 zero-click search study, built on clickstream panel data. Its headline is that for every 1,000 United States Google searches only 374 clicks reach the open web, and in the European Union it is 360. It also found that roughly 58.5% of American Google searches ended without any click at all, with searchers either ending the session or revising the query.
Three things that follow, and one that does not
It counts Google web searches in 2024. It counts clicks to the open web, which means clicks back into Google properties are excluded from that 374. And a meaningful share of the clicks that do happen are multiple clicks on one search, so the figure is not a per-person conversion rate.
What does not follow is that AI assistants caused it. The behaviour predates widespread AI answers and the study is not measuring ChatGPT, Claude or Perplexity at all. Quoting a 2024 Google clickstream figure as proof of AI’s impact is a category error, and it is in most articles on this subject. If you need to know what AI assistants are doing to your traffic specifically, none of these headline percentages will tell you. Your own numbers will.
The free data source almost nobody names
Bing Webmaster Tools has an AI Performance section that reports, at no cost, the queries where AI answers were grounded on your site, how many citations you got on each, your share of the citations on that query, and which of your pages were used.
We checked the top ten organic results for this topic on 3 September 2026. Not one of them mentions it. The field is writing about measuring zero-click search using Search Console, GA4, Semrush and Ahrefs, none of which reports a citation.
What each column means in practice
| Field | What it tells you | The trap |
|---|---|---|
| Grounding query | The question the assistant was answering when it used you | These are not the keywords you targeted. Expect long, spoken-sounding questions |
| Citations | How many times you were used as a source | Driven by how many people asked. See the next section |
| Citation share | Your citations on that query over all citations on it | This is the number. Everything else is context |
| Cited pages | Which URLs were used | Frequently not the page you would have guessed |
Two things to check before you trust any of it
First, confirm which property is selected. The dashboard can open on a different site in your account and show you a confident zero. We have made this mistake, and so has everyone we have compared notes with. Second, check the account. If you manage several Microsoft logins, an empty report often means the wrong one, not lost data.
Why citation totals lie, with our own numbers
This is the part we can prove rather than assert, and it is the reason this page exists.
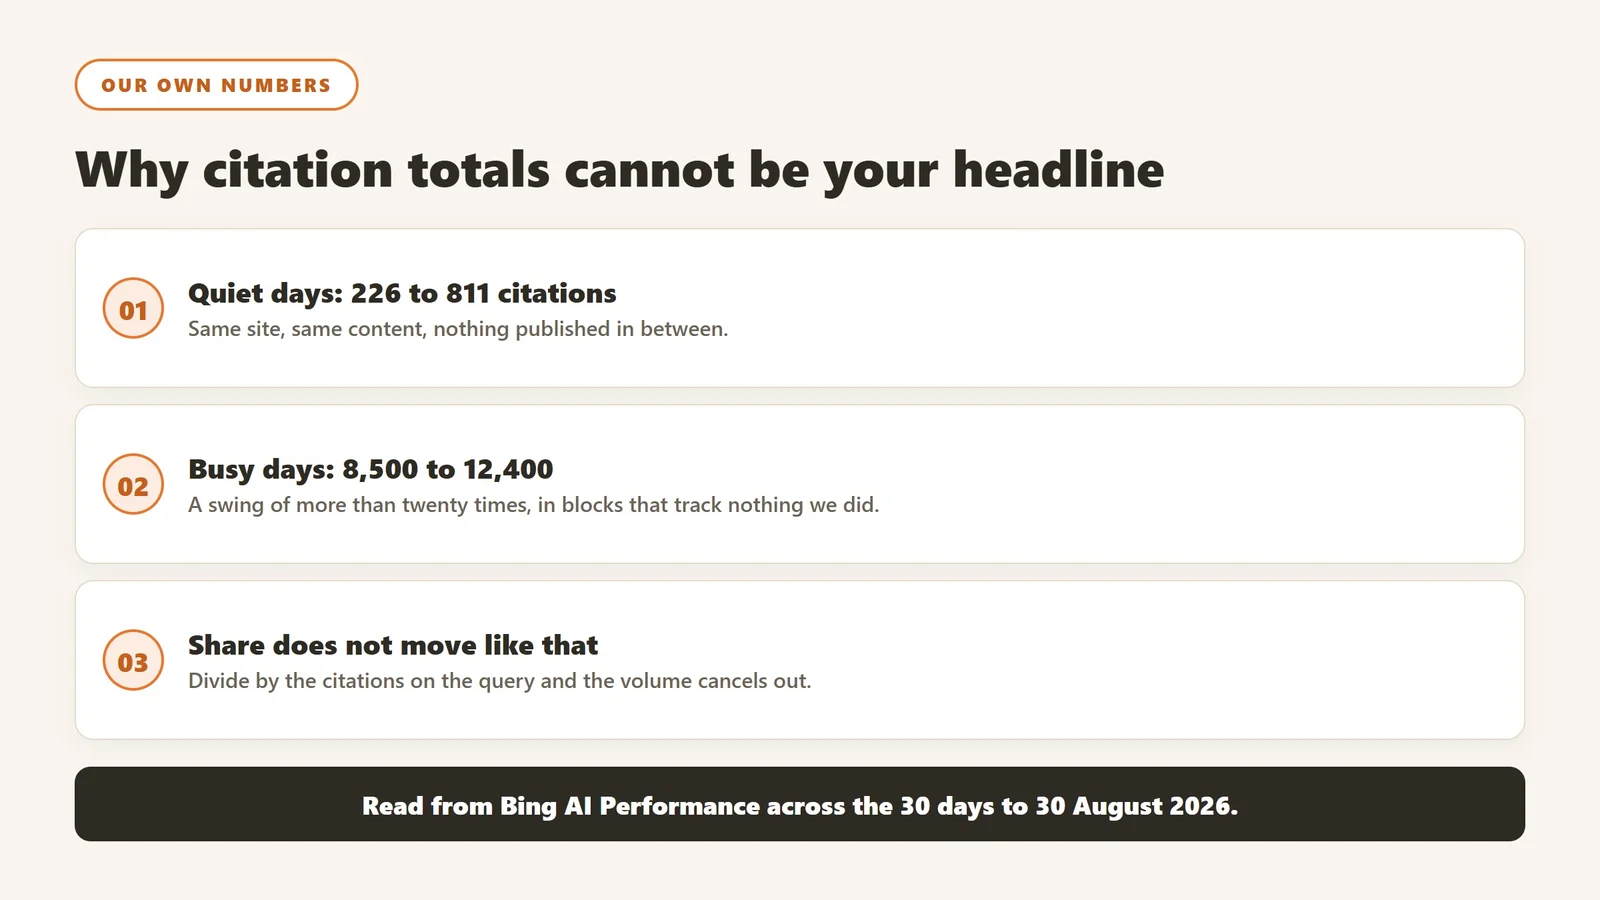
Across the 30 days to 30 August 2026, our own citation count on quiet days ran between 226 and 811. On busy days in the same month it ran between 8,500 and 12,400. Same site, same content, nothing published in between that could explain it. That is a swing of more than twenty times, arriving in blocks that track nothing we did.
The gaps look exactly like a collapse
Worse, the low periods arrive as runs of consecutive days. Ours, read 4 September 2026: 21 August 402 citations, 22 August 226, 23 August 319, 24 August 811, and then 25 August back to 10,800. A full recovery in a single day, and it was the third time we had seen the same shape in six weeks.
If you had opened the panel on 24 August you would have concluded the site had fallen off a cliff, and you would have been wrong. Before reporting any decline, check whether your last few days sit inside one of these gaps. A metric that can read 226 or 12,400 for identical work is not a metric you can put in a monthly report on its own.
Faz says: We reported a collapse to ourselves twice before working this out. The second time we spent a day investigating a drop that had already recovered. If your AI citation chart looks like a cliff, wait three days before you tell anyone.
Citation share, and why it is the only number that survives
Citation share divides your citations on a query by the total citations on that query, so the volume of people asking cancels out. If interest in a topic triples, your totals triple and your share does not move. That is exactly the property you want in a number you have to report every month.
Share is also the competitive figure, because your share and everyone else’s add up to the whole. We use that directly in how to monitor competitors in AI search results.
Count and share can move in opposite directions
Over three months to early September 2026 our cited page count rose by roughly a quarter while citations per cited page fell by about a third. Counted one way that is growth. Counted the other it is dilution. Only the share view showed both at once, and the two facts together, more pages cited and fewer citations each, is the actual story of what happened to us.
What good looks like
We hold a weighted share of about 25% across our top 25 grounding queries. Our best single page holds 61%, 48% and 35% on three related queries. Our worst holds 3.87%, and that query is the one this page was written to answer. Publishing our own worst number is the honest way to introduce a page about measuring badly, and it also demonstrates the point: we could see it because we were looking at share.
Matched pages against adjacent pages, and how to tell which you have
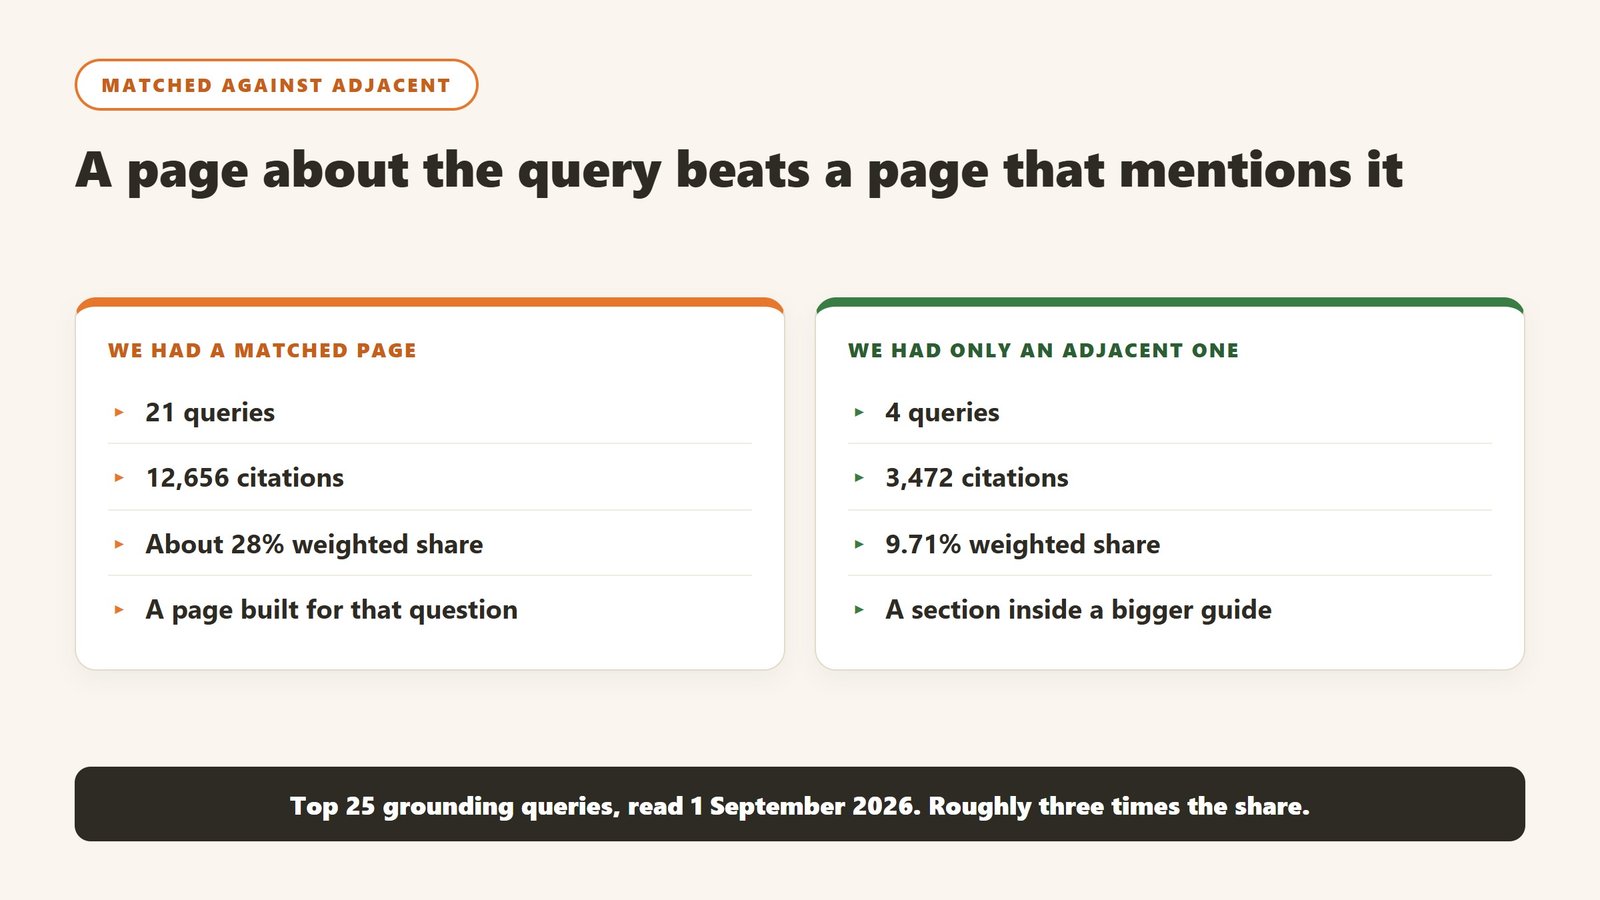
When we split our top 25 grounding queries by whether we had a page that matched the query rather than merely sat in the same topic, the split was stark:
| Queries | Citations | Weighted share | |
|---|---|---|---|
| We had a matched page | 21 | 12,656 | about 28% |
| We did not | 4 | 3,472 | 9.71% |
Read 1 September 2026, top 25 grounding queries, 30 day window. A matched page was worth roughly three times the share of an adjacent one.
The test for whether a page matches
Read the grounding query aloud and ask whether one of your pages is about that, not whether it mentions that. A 5,000 word buyer guide that contains a section on your query is an adjacent page. It will get cited sometimes, and it will lose most of the pool to whoever wrote a page about the specific thing. This is uncomfortable if you have invested in long pillar pages, and it was uncomfortable for us.
Why this happens
An assistant is assembling an answer, not ranking documents. It cites a source when that source supplies a specific fact the answer needs and nothing else in the retrieved set has already supplied. A general page carries the general facts, which the model either already has or can get anywhere. The competition is for the answer, not for the query.
What Google Search Console can and cannot tell you here
Search Console remains useful and it is not a zero-click tool. Be precise about the boundary so you do not over-claim in a report.
What it can do
It reports impressions and clicks for Google Search, so a page accumulating impressions with a falling click-through rate is the classic signature of an answer being read on the results page. That is a real and usable signal. It also survives as your record of ordinary organic performance, which still matters.
What it cannot do
It does not report AI assistant citations, it does not separate AI Overview appearances into their own row, and it cannot tell you that ChatGPT used your page. If a tool claims to give you Google AI Overview citation counts, ask exactly where the number comes from, because it is not coming from Search Console.
The referral number will mislead you, and here is our proof
The obvious way to measure AI is to count the visits it sends. We did that, and over the same period our numbers moved in opposite directions.
Comparing 28 August to 3 September 2026 against 17 to 23 August: our citations rose about 19% and our cited page count rose about 44%, while ChatGPT referral sessions fell about 40%. Being used more and visited less is not a visibility problem. It is the entire zero-click shift arriving in one report.
If you manage to a referral number you will conclude you are losing at exactly the moment you are winning. There is a fuller treatment of the analytics side in our guide to tracking ChatGPT traffic in GA4.
Finding your own unmatched queries in about twenty minutes
This is the exercise that turns the whole thing from a dashboard into a work queue, and it needs no tool beyond the free panel.
The procedure
Open Bing Webmaster Tools, confirm the property, and go to AI Performance. Sort grounding queries by citations and take the top twenty five. For each one, write down the single page on your site that is about that query, or write nothing if there is not one. Then note the citation count and your share against each.
Reading the result
Sum the citations on the rows where you wrote nothing. That total is the pool you are currently losing most of, and ranking those rows by citations gives you your content plan in citation order rather than in guesswork order. When we did this the four unmatched rows carried 3,472 citations between them, which was a fifth of the whole top-25 pool sitting behind pages we had never written.
The judgement call it forces
Some of those rows will be things you deliberately do not cover, and you should leave them. The useful ones are the queries that are obviously your subject where you happen to have written the general version instead of the specific one. That gap is usually not a strategy problem. It is a page that got written as a section.
What to actually put in a monthly report
Five lines. Anything longer gets skimmed, and anything shorter hides the dilution pattern.
| Line | Source | Why it is there |
|---|---|---|
| Weighted citation share across your top queries | Bing AI Performance | The headline. Volume-independent |
| Cited page count | Bing AI Performance | Breadth of coverage |
| Queries where you have no matched page | Your own audit | This is your work queue, ranked by citations |
| Impressions and click-through rate on top pages | Search Console | The read-but-not-visited signature |
| AI assistant sessions and engagement rate | GA4 | Context only. Never the headline |
Take the baseline before you start
Whatever you decide to count, capture it for a fortnight before you change anything. It takes minutes a day and it is unrecoverable afterwards. Almost every team that cannot say whether their AI search work paid off simply never wrote down where they started.
What no tool can measure yet
Be honest about the edges of this, because vendors will not be.
Most of the assistants report nothing
There is no ChatGPT equivalent of Bing Webmaster Tools. No first-party panel tells you that ChatGPT, Claude or Gemini used your page. Everything sold as ChatGPT visibility monitoring works by asking the model a set of prompts on a schedule and recording what comes back, which is sampling, not reporting.
Sampled prompts are a survey, not a census
That approach is genuinely useful and it has real limits. Answers vary between runs for the same prompt, they vary by the asker, and a tool checking 500 prompts is telling you about 500 prompts. Ask any vendor how many prompts, how often, from where, and how much answers varied between runs. A tool that will not answer the last one has not looked.
Nobody can measure the answer you were left out of
The hardest gap is invisible by construction. You can see the queries where you were cited. You cannot see the queries where you should have been and were not, because nothing generates a record of an absence. The nearest workaround is to write down the questions your customers actually ask, check them by hand, and treat every one you lose as a page you have not written.
Where the figures on this page come from
Every first-party figure here is our own, read from our own reporting on the date given, and dated because these numbers move. Citation and share figures come from Bing Webmaster Tools AI Performance, read 1 and 4 September 2026 for the 30 day and 7 day windows. Session and engagement figures come from Google Analytics 4, comparing 28 August to 3 September 2026 against 17 to 23 August. Impression and click behaviour is from Google Search Console.
We do not publish our three month citation total, because Bing describes that view as a sample rather than a count and it would be misleading to quote as one. We also do not publish figures we cannot source, including for tools we have not been able to read.
Related reading
For which monitoring tool to buy, see the best AI search monitoring tools. For the wider comparison, the best AI visibility tools. For the practice rather than the measurement, our guide to generative engine optimization.

Written by
FazFaz is the founder of AIToolsBakery. Some tools here are tested hands on. Others are assessed from vendor documentation and pricing verified on the live page, and every review says which one it is. Sponsors can buy a position in a guide. They cannot buy the score, the criticism, or silence about a better option.
How we test and how we make money →