The short answer
Competitor monitoring in AI search is two separate jobs, and conflating them is why most teams overpay for it.
The first job is knowing how much of a question you are losing. That is free. Bing Webmaster Tools reports your citation share per query, and share is a competitive figure by construction: if you hold 5.82% of the citations on a question, the other 94.18% belongs to somebody, and the size of the pool tells you whether it is worth chasing.
The second job is knowing who has it. That is not free, because no analytics panel will name a rival for you. It requires sampling the assistants yourself or paying someone to sample them for you.
| Question | Can you answer it free? | How |
|---|---|---|
| Which questions do AI answers use me for? | Yes | Bing Webmaster Tools, grounding queries |
| How much of each question am I losing? | Yes | Citation share, same report |
| Which of my pages get used? | Yes | Cited pages, same report |
| Which rival holds the rest? | No | Sample by hand, or pay a tool |
| Did a rival gain on me this month? | Partly | Your share falling is the signal, not the cause |
| What are they saying that I am not? | No | Read the answer text, by hand or sampled |
This page is the method. If you want the tool comparison instead, that is our AI search monitoring buyer’s guide, and the tools that find your blind spots specifically are in our gap analysis guide. This page assumes you have no tool yet and want to know whether you need one.
Why share is the competitive metric and totals are not
The instinct is to track how many times AI answers cite you and watch the line go up. That number is close to useless on its own, and it is worth understanding exactly why before you build a report around it.
Totals move for reasons that have nothing to do with you
Our own citation totals have run from 226 on a quiet day to 12,400 on a busy one inside a single month, on content that did not change. Assistants ask more questions in some weeks than others, and a spike is usually a machine asking, not a market moving. If you report totals to a board, you will be explaining a 20x swing that means nothing.
Share does not behave that way. It is your citations on a question divided by all citations on that question, so the volume cancels out. When your share moves, something actually changed in the competitive position.
Share is competitor data that nobody labels as competitor data
This is the part that gets missed. A share figure already contains your rivals. Holding 5.82% of a question means 94.18% of the answer-building on that question is drawing on somebody else. You do not know their names yet, but you know the size of the prize and you know you are not winning it, which is enough to decide whether to investigate further.
It also tells you where not to spend. We hold about 61% on one question and about 3.6% on another with four times the volume. The 3.6% looks like the emergency. It is not: that one is a bare brand-name query where the vendor’s own site and the review aggregators will always take most of the pool. Share plus query shape tells you which losses are structural and which are winnable.
Faz says: Track share weekly, totals never. The first time a total spikes you will want to email everyone. Wait a week and it will have gone back down on its own.
The free method, step by step
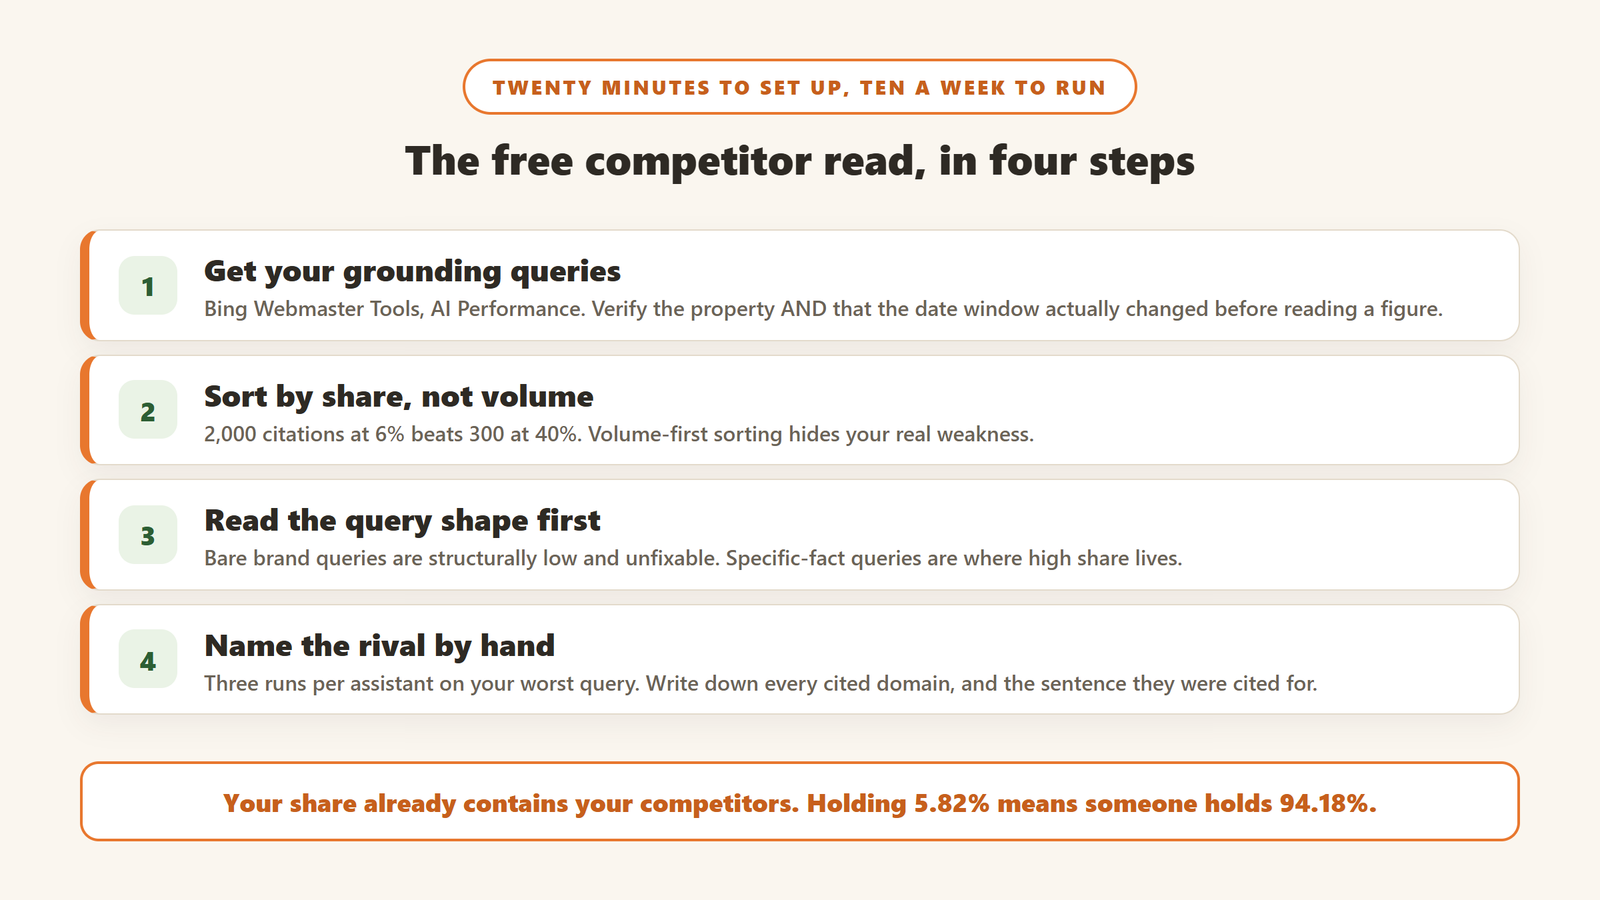
This takes about twenty minutes to set up and ten minutes a week to run. Everything in it is first-party or free.
Step one: get your grounding queries
Bing Webmaster Tools has an AI Performance report that lists grounding queries, citations per query, your citation share on each, and which of your pages were used. Bing feeds Microsoft Copilot, which is why this exists at all, and it is the only free panel of its kind that we know of. None of the ten organic results we read for this topic on 7 September 2026 mentioned it.
Two traps, both of which have cost us real time:
Check which property is selected. The dashboard can open on a different site in your account and show a confident zero. We have done this and briefly believed a month of data had vanished.
Check the window actually changed. On 7 September 2026 the panel opened on the three month view, and a normal click on the 30 day tab did not take: the selected tab stayed on three months while the headline total changed, which reads exactly like a successful switch. Read the date range back before you trust a figure. A comparison between two windows you did not verify is worse than no comparison.
Step two: sort by share, not by volume
Order your queries by share ascending and look at the ones with real volume behind them. That list is your competitive weakness in priority order. A question with 2,000 citations where you hold 6% is worth more attention than one with 300 citations where you hold 40%, and volume-first sorting hides that completely.
Step three: read the query shape before reacting
Sort each low-share query into one of three shapes, because they have different cures.
Bare brand queries, a company name and nothing else, will always have low share. The vendor owns their own name and the aggregators take the rest. Leave them alone.
Category queries, best tools for X, are winnable and crowded. Expect to land somewhere around 20 to 30% if you are good.
Specific-fact queries, essential features of X or how much X costs, are where share goes high, because few sources carry the specific fact. Our highest shares are all of this shape. These are the ones to build for.
Step four: name the rival by hand
Take your worst-share query with real volume, put it to Copilot, ChatGPT and Perplexity as a buyer would phrase it, and write down every domain cited in the answer. Do it three times per assistant, because the same prompt returns different sources between runs. Ten minutes gives you the list of who is actually taking that 94%, which is the thing no free panel will tell you.
Keep the answers, not just the domains. What you are looking for is the sentence they were cited for. That sentence is the fact you do not have on your page.
What the free method cannot do
Being honest about the ceiling here matters, because it is where the paid tools earn their money.
It is Microsoft only
Bing’s panel covers Microsoft Copilot and its partners. It does not see ChatGPT, Claude, Gemini or Perplexity. If your buyers live in one of those, the free panel is a proxy and you should say so out loud in any report you write from it.
It cannot show you the absences
You can see the questions you were cited on, because being cited creates a record. Nothing creates a record of not being cited. The questions where you should have appeared and did not are invisible, and that is the largest blind spot in the whole discipline. The only workaround is to write down the questions your buyers ask and check a sample by hand.
Hand sampling does not scale, and it is a survey
Three runs of one prompt across three assistants is thirty minutes of work for one question. Doing that for fifty questions weekly is a job. This is exactly what the tools automate, and it is worth being clear that they are doing the same thing you would do: asking a fixed prompt set on a schedule and recording what comes back. That is a survey, not a census, and it inherits every limitation of a survey.
What the tools charge, verified 7 September 2026
We read each of these pricing pages in a real browser on 7 September 2026 and recorded the URL we landed on. Where a vendor publishes nothing, we say so rather than inferring a figure.
| Tool | Entry | Mid | Top published | Basis |
|---|---|---|---|---|
| Otterly.AI | $29/mo | $189/mo | $489/mo, Enterprise from $1,000/mo | Monthly view. Annual shows $25 and $160 |
| Knowatoa | $59/mo | $199/mo | Enterprise not priced | Page states USD, cancel anytime |
| Peec AI | $80/mo | $205/mo | $420/mo | Annual saves $180, $480 and $900 |
| Rankscale | from $20/mo | $99/mo, 1,200 credits | $780/mo, 12,000 credits | Credit-metered, not seat-metered |
| Scrunch AI | $250/mo | Not published | Not published | Extra users $25/mo, or 5 seats for $75/mo |
| Evertune | $800/mo | Not published | Not published | Includes 100,000 prompts tracked |
| Semrush | $139/mo | $199/mo | $299/mo | Monthly. Annual shows $117.33, $165.17, $248.17 |
| Ahrefs | $129/mo | $249/mo | $449/mo, Enterprise $1,499/mo | Extra users $40, $60, $80/mo by tier |
| Profound | Publishes no figure. Its pricing page renders in full and contains no price | Quote only | ||
The spread is the finding
Entry pricing in this category runs from about $20 a month to $800 a month for what vendors describe in near-identical language. That is a 40x spread on a feature list that reads the same, which tells you the feature list is not what you are buying.
What actually differs underneath is the sampling budget. Rankscale is explicit about it and meters in credits used to query AI engines. Evertune states a prompt volume, 100,000 tracked, next to its price. Otterly.AI sells extra prompts as an add-on at $99 per hundred, which prices the unit directly. Those three are telling you the truth about what the product is. A vendor who will not tell you the prompt volume is selling you an unknown quantity of the only thing that matters.
The question to ask every vendor
How many prompts, how often, from which locations, and how much did the answers vary between runs on the same prompt. If a vendor cannot answer the fourth one, they are not measuring variance, which means their week-on-week movement includes noise they cannot separate from signal.
Faz says: Ask for the prompt volume before the demo. It converts a feature conversation into an arithmetic one, and arithmetic is much harder to sell past.
What to actually put in a weekly report
After running this on our own site for months, this is the shortlist that survived. Everything else we put in a report got dropped for moving on its own.
| Metric | Why it stays | Cadence |
|---|---|---|
| Citation share on your top 25 queries | Volume-independent, and it already contains your rivals | Weekly |
| Count of queries where you have a matched page | The single strongest predictor we have measured | Monthly |
| Distinct cited pages | Breadth. Rises when coverage genuinely improves | Weekly |
| Named rival domains on your five worst queries | The only true competitor field, and it is manual | Monthly |
| Swung more than 20x for us on unchanged content | Do not report alone | |
| Can move opposite to visibility. See below | Context only |
The matched page number is the one that moves
Splitting our own top 25 grounding queries on 1 September 2026 by whether we had a page that matched the query rather than merely sat in its topic: the 21 matched queries held about 28% weighted share, and the 4 unmatched held 9.71%. A matched page was worth roughly three times an adjacent one.
We then checked that against a real build. We published a page for one of those unmatched queries on 1 September, and by 5 September its share had moved from 11.88% to 13.38% on a pool of 2,000 citations. One page, one query, measurable inside a week. That is the closest thing to a controlled result we have on this.
Why referral traffic misleads on exactly this question
Comparing late August to early September 2026 against the previous fortnight, our AI citations rose about 19% and our cited pages about 44%, while ChatGPT referral sessions fell about 40%. If we had managed to the referral number we would have concluded we were losing at the precise moment we were being used more. Keep it as context. Never make it the top line. We go through this in detail in our guide to tracking ChatGPT traffic.
Three failure modes we have hit ourselves
Reporting a decline that had already recovered
Our panel dropped to 402, 226, 319 and 811 citations across 21 to 24 August 2026 and returned to 10,800 on 25 August. A full recovery in a day, and the third time we had seen the identical shape in six weeks. It was a reporting gap, not a decline. Wait three days before you investigate a drop, and check for a gap before you write the word cliff.
Treating low share as a content problem when it is a query problem
The worst share on our site sits on a bare brand-name query where we are already the 22nd most cited page on our own domain for that brand. The share is low because the pool is shared with the vendor and the aggregators. There was nothing to fix, and building another page would have cannibalised one that was working.
Recommending a company that no longer traded under that name
This is not strictly a monitoring failure but it is the one that costs the most credibility, and competitor monitoring is where you catch it. We recommended a vendor that had been acquired nine months earlier, and separately kept naming a product whose company had merged into another. Neither a price check nor a freshness check catches this, because there is no wrong figure to find. Record the final URL your check landed on, and flag it when the domain is not the one you requested.
Where this fits with our other guides
Four pages on this site answer four different questions, and it is worth being explicit so you do not read the wrong one:
Best AI visibility tools is which tool to buy. Best AI search monitoring tools is the buyer’s guide with the data quality tests. Gap analysis tools is finding your own blind spots. How to measure zero-click search is the measurement framework underneath all of them. This page is the competitive read, and it is the one to start with if you have no tool and no budget yet.
How we know this
We run this method on our own site every week. The figures in this article are our own Bing Webmaster Tools data, dated where quoted, and the vendor prices were read off each vendor’s own rendered pricing page on 7 September 2026 with the landed URL recorded.
We have not run trials of the eight monitoring tools priced above and we are not ranking them here. Where a price is absent we report it as absent rather than estimating, and two of the pages we read served regional variants without being asked, so treat any figure as the one shown to us from our location and confirm it from yours.

Written by
FazFaz is the founder of AIToolsBakery. Some tools here are tested hands on. Others are assessed from vendor documentation and pricing verified on the live page, and every review says which one it is. Sponsors can buy a position in a guide. They cannot buy the score, the criticism, or silence about a better option.
How we test and how we make money →