An impact report is the most important stewardship document most nonprofits produce each year. It is where donors see whether their gifts did what they were promised, and it is often the thing that decides whether they give again. Yet most guides to writing one either offer a design template with no guidance on content, or list examples from national brands, many of them several years old.
This guide gives you a section-by-section template, then walks through six real impact and annual reports published for 2024 and 2025, from a food pantry that raised $1.2 million to charity: water’s $104.9 million year. For each, it notes what the report does well and, where we found one, a mistake worth avoiding in your own. If your team struggles to pull the numbers together, Gratefully builds board and portfolio reports from your CRM data with every figure traced to its source records, and has a free plan.
About the examples. We opened every report below on 18 September 2026 and describe what we saw. Figures are quoted from the reports themselves. Where we point out an error, the arithmetic is ours, based on the report’s own figures.
Impact report vs annual report
The AFP Fundraising Dictionary defines an annual report as “a yearly report of the financial and program status of an organization or institution.” An impact report is narrower and more donor-facing: it leads with outcomes and gratitude, and treats the finances as one page rather than the main event. Many organisations publish both. The Richmond Food Bank Society’s 2025 Impact Report, a short web post, says its full 2025 annual report “will be released in the upcoming months”, which is the pattern in miniature: a fast, readable impact report for donors, and a fuller annual report later.
What to include: an impact report template
| Section | What goes in it | Length |
|---|---|---|
| 1. Thank you | A short letter from leadership that thanks donors before any numbers | One paragraph to a page |
| 2. The headline | One number that sums up the year, with last year’s figure beside it | A single panel |
| 3. What you did | Three to five outcomes, each with a comparison to last year | A page |
| 4. Stories | Two or three real people or cases, with permission, in their own words where possible | A page |
| 5. The money | Where revenue came from and where it went, in plain language, matching your Form 990 or audited accounts | A page |
| 6. Your supporters | Volunteers, partners and donors thanked, with recognition preferences respected | As needed |
| 7. Looking ahead | What next year’s gifts will make possible | Half a page |
| 8. How to help | One clear way to stay involved, not a hard ask | A few lines |
Four to eight pages is plenty for most organisations, and a web version that can be read on a phone matters more than print. Burk’s research, summarised in her donor-centred fundraising handout, lists providing measurable results on the last gift before asking for another as one of three essentials of donor-centred fundraising, which is exactly the impact report’s job.
Six real impact reports, and what to learn from each
1. Centre Street Food Pantry, 2025 Donor Impact Report (small)
The Centre Street Food Pantry’s report reports “$1,203,000 fundraising total, increase of 47% over 2024” from 1,800 donors. Page two is a thank-you letter from two leaders, before any statistics. Stat pages alternate with named client quotes, and almost every number carries a year-on-year comparison, such as 51,018 people served, its highest ever, and 13,067 household visits, 9% more than 2024. A one-page finances section shows revenue by source and states that 93% of the 2025 budget went to food and program expenses.
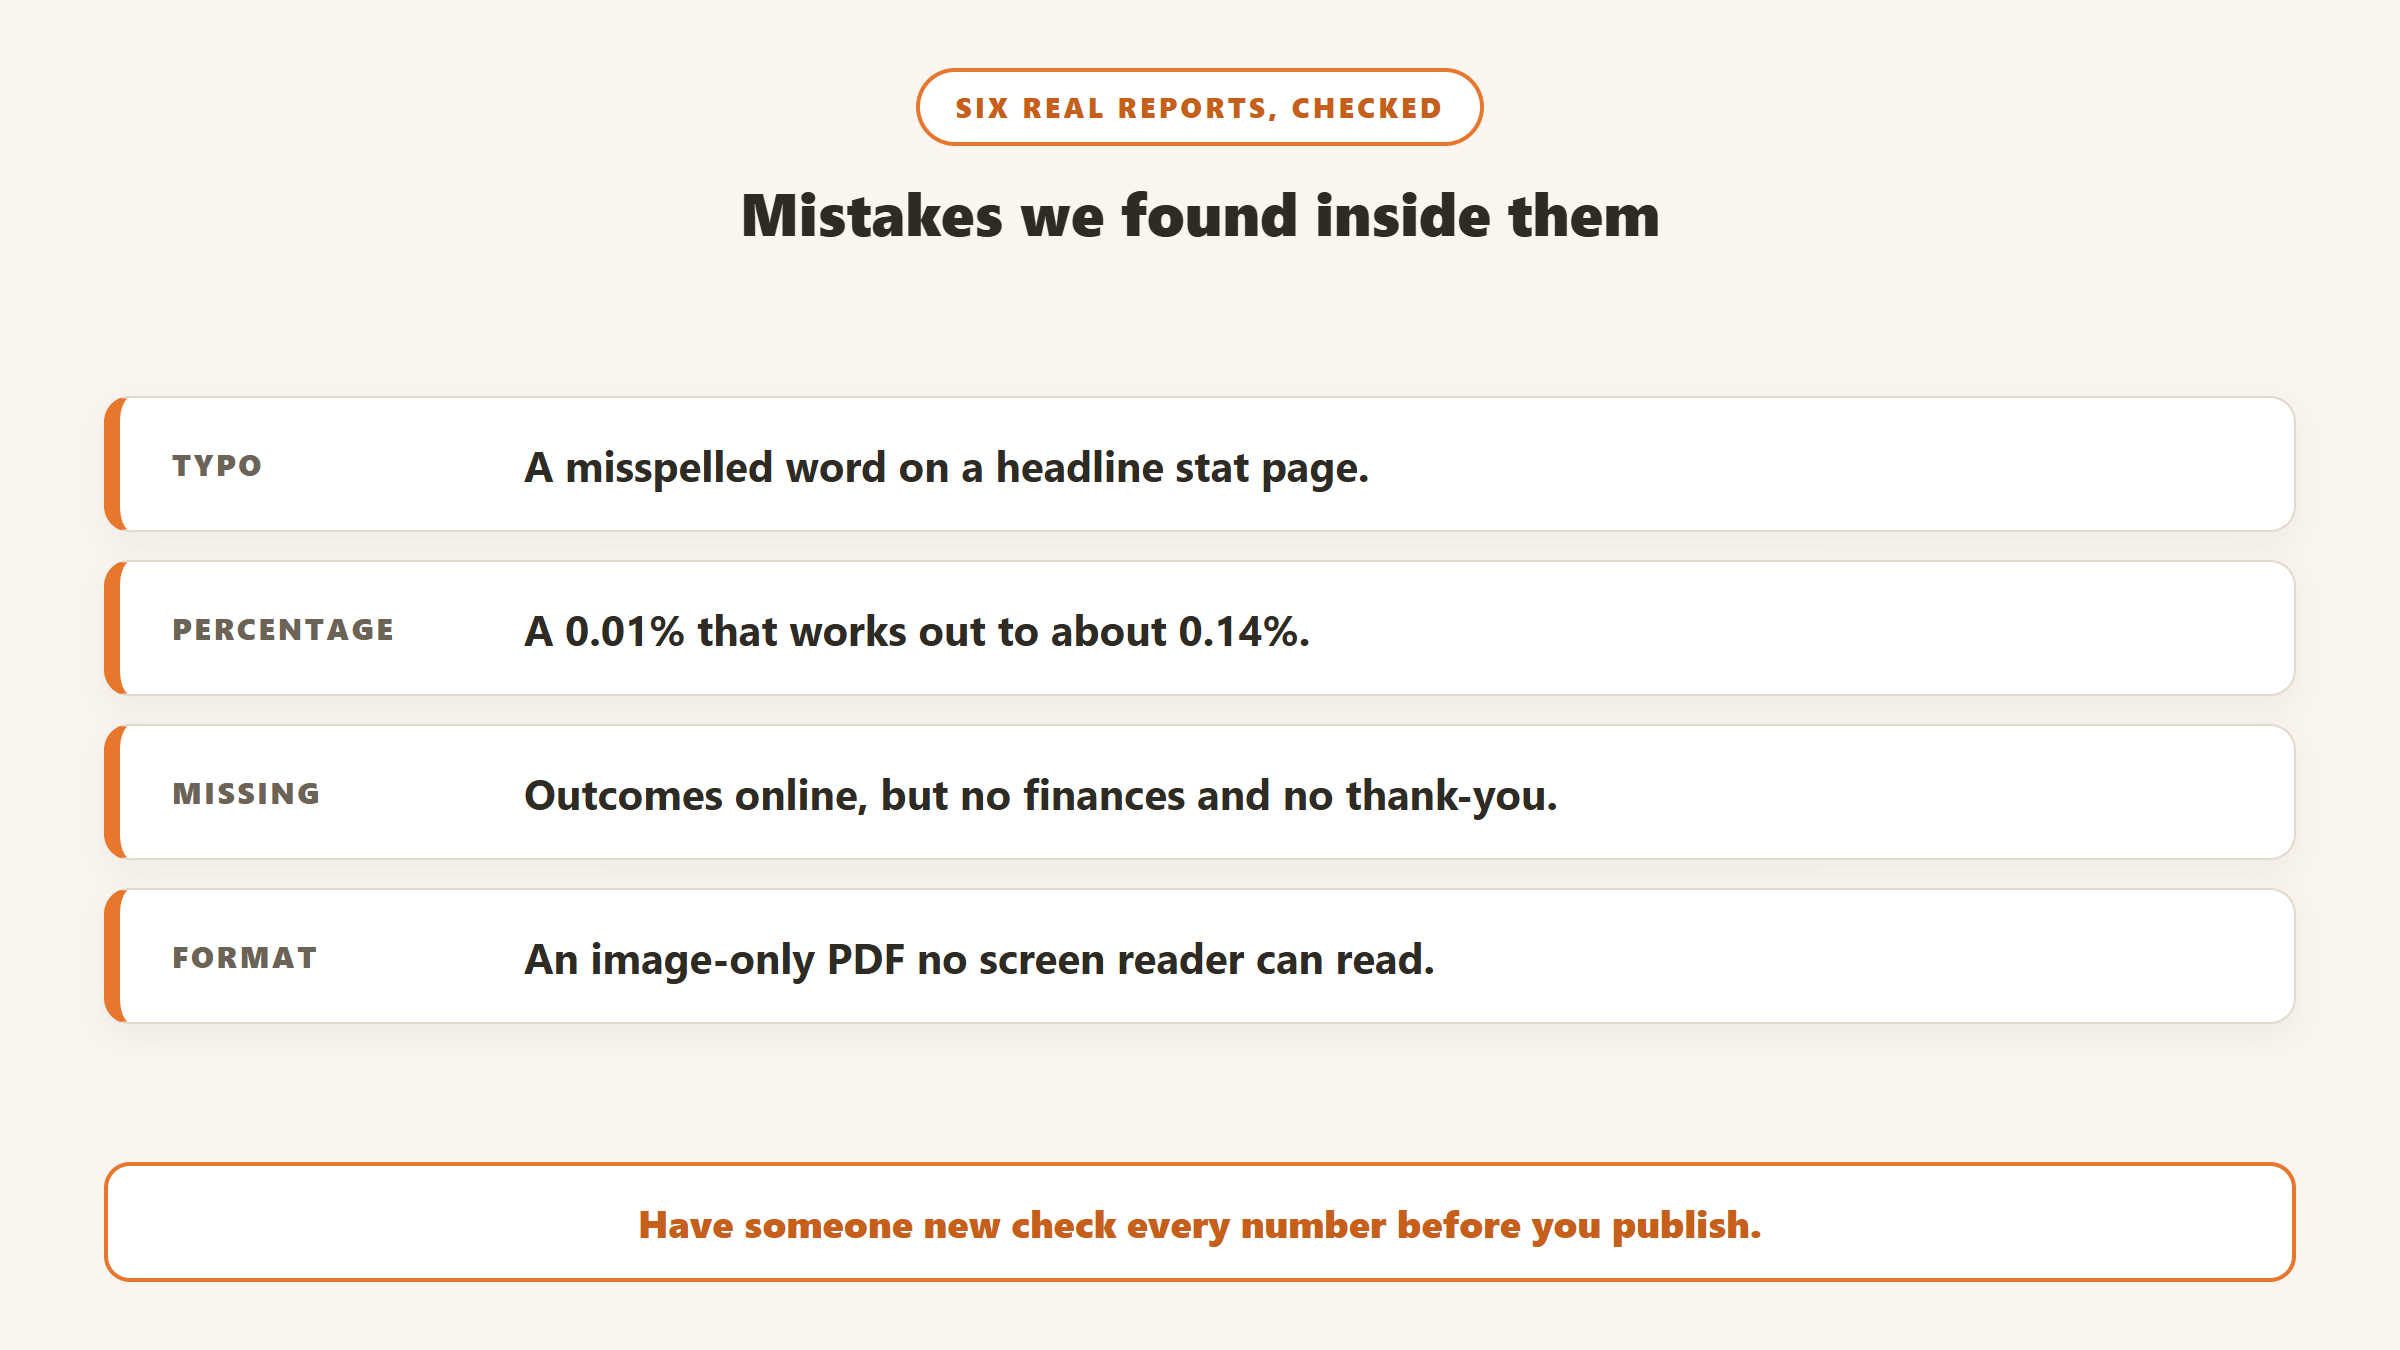
To avoid: one stat page prints “CHILDEN SERVED”, a typo on a page designed to be read in a glance. And the report is an image-only PDF inside an embedded viewer, which screen readers and search engines cannot read. Publish a text version alongside the designed one.
2. Richmond Food Bank Society, 2025 Impact Report (small to mid)
A short web post rather than a designed document, with clear comparisons: 64,533 visits, a 3% increase on 2024, and 842,655 kilograms of food, up 29%. It thanks named donors who gave $10,000 or more and links an infographic. It shows that an impact report does not need a designer to work, and that it can come out quickly while the fuller annual report follows.
3. KEXP, Annual Report 2024 (mid)
KEXP’s report opens with a CEO letter addressed “Dear Friend”, then a year-at-a-glance page including 31,842 donors, and listener quotes with first name and city. Its financial section is a model of plain language: each revenue line gets a sentence, individual donors provide “$9,564,410 in income” or 57.1% of revenue, and it states openly that fundraising expenses were 16.9% of overall expenses, “covering fundraising staff and systems, as well as the production and shipping of thank you gifts.”
To avoid: one line reads “$23,630 or 0.01% of 2024 revenue”. On the report’s own figures, $9,564,410 being 57.1% puts total revenue near $16.75 million, which makes $23,630 about 0.14%, not 0.01%. Small, but the kind of error a careful donor notices. Check every percentage against its total before you publish.
4. Atlanta Humane Society, 2024 Impact Report (mid)
Atlanta Humane leads with one number, “143,407 Animals Impacted”, and shows it as a three-year trend: 55,005 in 2022, 74,668 in 2023 and 143,407 in 2024. The web version pairs each program with a named animal’s story. It is the clearest example of a headline number done well.
To avoid: the web page we read had no financial section and no donor thank-you. Outcomes without money or gratitude answer “what happened” but not “what did my gift do” or “do you appreciate it”.
5. charity: water, Fiscal Year 2024 Annual Report (large)
charity: water’s report builds a simple chain in its opening: it “raised more than $92 million and funded over 30,400 water projects, which will help bring clean and safe water to more than 1.5 million people”. Its financials give total revenue of $104.9 million, split between money raised for water projects and money raised for operating expenses, and expenses by function: 77% program services, 13% fundraising and 10% management and general. It explains its model that 100% of public donations fund water projects, with operating costs covered separately, and points readers to its audited statements. It closes: “Thanks to you”.
6. Midwest Food Bank, 2025 Annual Impact Report (large)
Midwest Food Bank leads with “$548M in food and resources” distributed in 2025 and uses clickable section tabs so readers can jump straight to finances, programs or volunteers. Its “revenue conversion model” shows financial donations of $25 million alongside $555 million of rescued and sourced food. It also states that more than 99% goes to program services. When donated goods are valued in the hundreds of millions against $25 million in cash, a ratio close to 100% is almost automatic, so showing cash and in-kind separately, as the conversion model does, is the honest way to present it.
Writing the stories
Numbers show scale; stories show what a gift actually does for one person, animal or place. The reports above use them in different ways: Centre Street alternates client quotes with stat pages, KEXP quotes listeners by first name and city, and Atlanta Humane gives each program a named animal. A few rules make stories work:
- Get permission, in writing, and let people choose how they are named.
- Use their words where you can. A short quote beats a paragraph of description.
- Connect the story to a number on the same page, so the reader sees one example of the total.
- Show change, not just need: where the person started, what happened, where they are now.
- Keep dignity first. Avoid images and phrasing that reduce people to their hardship.
When to publish
Timing matters as much as content. An impact report that arrives nine months after the year it describes reads as an afterthought; KEXP’s CEO letter openly acknowledges its report is late and that the context has changed since. Aim to publish within a few months of your year end. If the full annual report takes longer, do what the Richmond Food Bank does: publish a short impact update first and the full report later.
Many organisations pair the impact report with the year-end giving summary. IRS Publication 1771 notes that charities typically send written acknowledgments by January 31 of the following year, and one annual summary can cover several gifts, so the two can go out together: the summary for the donor’s taxes, the impact report for the donor’s reasons.
Getting the financial page right
Donors can check your numbers. The IRS requires exempt organizations to make their annual return, including Form 990, available for public inspection for three years, and most are easy to find online. Your impact report’s financial page should therefore reconcile to your 990 or audited accounts, and say which it uses.
- Show where money came from by source: individuals, foundations, government, corporate, events.
- Show where it went by function: programs, fundraising, management. KEXP’s approach of explaining each line in a sentence works for any size.
- Separate cash from in-kind if in-kind is large, as Midwest Food Bank does.
- Name the fundraising cost openly. Our fundraising metrics guide explains why a cost-to-raise figure taken straight from Form 990 can understate event costs.
Donor lists and recognition
Many impact reports end with pages of donor names. Burk’s survey work suggests these matter less to donors than organisations assume: her handout reports that 8% of donors said publishing names in newsletters and annual reports influenced their giving, down from 32% in her original research. Recognition still matters to some donors, so keep lists if you have them, but record each donor’s preference, respect anonymity, and spend more of your pages on results.
Does transparency pay?
Candid’s 2025 study of 148,786 nonprofits that filed Form 990 for fiscal years ending in 2022 and 2023 found that organizations with its Seal of Transparency “averaged 62% more in donor contributions” than those without. Two cautions: it is an association, not proof that transparency causes giving, and Candid is studying its own Seal. Candid itself says there is “no guarantee” that earning a Seal will increase donations. The direction is still encouraging for anyone deciding how open to be.
Format and accessibility
- Publish a web page, not only a PDF. A web version can be read on a phone, shared as a link and found by search.
- Avoid image-only PDFs. If the only version is a designed image, screen readers and search engines cannot read it.
- Add alt text to charts and photos, and make sure headline numbers are real text.
- Keep it short. A donor should get the story in two minutes; detail can sit in the annual report.
- Make it easy to navigate. Midwest Food Bank’s clickable section tabs let a reader jump straight to the finances or programs they care about, which helps in any document longer than a few pages.
- Send it, do not just post it. Email the web link to donors with a short personal note, and give major donors a printed copy with a handwritten line.
Your pre-publication checklist
- Does it thank donors before it reports numbers?
- Is there one headline number, with a comparison?
- Does every percentage add up against its own total?
- Do the finances match the 990 or audited accounts, and say which?
- Have the people in the stories given permission?
- Are donor names listed only as each donor prefers?
- Has someone who did not write it proofread the stat pages?
- Is there a text or web version that works on a phone and with a screen reader?
The impact report is also a natural companion to your year-end giving summary, which the IRS accepts as a single acknowledgment for several gifts. Our donor stewardship guide covers how the two fit into a stewardship calendar, and AI board fundraising reports covers the internal version for your board.
Pulling the numbers together
The hardest part of an impact report is often not the writing but getting reliable numbers out of the CRM. Gratefully is a donor intelligence layer that sits on top of your CRM and helps with the internal side. Its portfolio reports page says it outputs reports “in the structure your board expects: headline metrics, narrative summary, risks and opportunities, asks for the room”, that each number links back to the underlying CRM query and source records, and that you can edit in place, redact personal data and export to PDF or share a live link. Its Action Center shows it preparing giving summaries and impact metrics. It is a reporting and intelligence tool, not a designer of public impact reports, and not a CRM.
Gratefully’s pricing page, read on 18 September 2026, has a Free plan, and every new account starts with a 14-day trial of its Advanced plan with no card required before moving to Free. Paid plans start at $79 a month billed yearly. See our Gratefully review.
Disclosure: Zilwaris, the consultancy run by AI Tools Bakery’s founder, does paid advisory work for Gratefully. Gratefully did not pay for this placement, and it is assessed on the same criteria as everything else on this site.
Where the facts on this page come from
- Impact and annual reports of Centre Street Food Pantry (2025), Richmond Food Bank Society (2025), KEXP (2024), Atlanta Humane Society (2024), charity: water (FY2024) and Midwest Food Bank (2025), all opened on 18 September 2026.
- AFP Fundraising Dictionary (copyright 1996 to 2003), definition of annual report.
- IRS, public disclosure and availability of exempt organizations’ returns.
- Candid, “Transparency boosts contributions to nonprofits”, 31 July 2025.
- Penelope Burk, Cygnus Applied Research, donor-centred fundraising handout, 2021 (survey data).
- Gratefully: portfolio reports, Action Center and pricing pages, read 18 September 2026.
The bottom line
A good nonprofit impact report thanks donors first, leads with one number and a comparison, tells a few real stories, shows the money plainly in a way that matches your Form 990, and looks ahead. The six real reports above show each of those done well, and also show how easy it is to ship a typo, a wrong percentage or a PDF nobody can read. Keep it short, publish it on the web, and have someone new check every number before it goes out.

Written by
FazFaz is the founder of AIToolsBakery. Some tools here are tested hands on. Others are assessed from vendor documentation and pricing verified on the live page, and every review says which one it is. Sponsors can buy a position in a guide. They cannot buy the score, the criticism, or silence about a better option.
How we test and how we make money →