
Most nonprofits track how much they raised. Fewer track what it cost to raise it, which donors it came from, and whether those donors will still be giving next year. Those are the questions a board, a funder or a new development director will ask, and they are answered by a handful of metrics that are simple to define and easy to get wrong.
This guide covers the five that matter most: cost to raise a dollar, donor acquisition cost, average gift, fundraising return on investment and donor retention. For each one it gives the formula, a worked example, and a benchmark from a primary source with its year, so you know what you are comparing against. It also flags the common error that makes a lot of published cost-to-raise figures look better than they are. Tracking these well is mostly a data job: gifts need appeal codes, costs need to be recorded against the same codes, and donors need to be counted once. If you want help seeing which donors are driving the numbers, Gratefully works on top of your CRM and has a free plan.
About the benchmarks. Every benchmark below comes from a named report, read on 18 September 2026, with the year of the data stated. Where a widely quoted figure could not be traced to a primary source we could read, we leave it out and say so. Several popular benchmarks are averages skewed by large gifts, and we flag those too.
The five metrics at a glance
| Metric | Formula | Benchmark and source |
|---|---|---|
| Cost to raise a dollar | Fundraising costs ÷ contributions raised | No more than $0.35 per $1 of related contributions (BBB Wise Giving Alliance Standard 9) |
| Fundraising ROI | Contributions raised ÷ fundraising costs | Direct mail to active donors returned $4.51 per $1; prospect mail $0.41 (M+R Benchmarks 2026, 2025 data) |
| Donor acquisition cost | Acquisition spend ÷ new donors acquired | No sector-wide dollar figure published; see below |
| Average gift | Total raised ÷ number of gifts | Direct mail average gift $120 (M+R 2026); use your own median as well |
| Donor retention | Donors who gave last year and this year ÷ donors who gave last year | 43.3% overall, 18.9% new, 59.3% repeat, full-year 2025 (Fundraising Effectiveness Project) |
Cost to raise a dollar
The formula
Cost to raise a dollar is total fundraising costs divided by total contributions raised in the same period. If you spent $60,000 on fundraising, including the share of salaries, software and overhead that belongs to it, and raised $400,000 in contributions, your cost to raise a dollar is $0.15. The same figure is sometimes expressed as a percentage, 15%, or inverted as fundraising efficiency or return on investment, $6.67 raised per $1 spent.
The hard part is not the division. It is deciding what counts as a fundraising cost. Staff time, a share of rent, your CRM subscription and payment processing fees all belong in it if they serve fundraising, and many organisations leave them out, which makes the number look better than it is.
The Form 990 trap
The quickest way to find your cost to raise a dollar is to take fundraising expenses from your Form 990, the column (D) figure in Part IX, and divide by contributions. That is also where the most common error comes from. The IRS instructions for Form 990 say fundraising expenses in column (D) are the costs of soliciting contributions, gifts and grants, including allocable overhead. Then they add: “Report direct expenses of fundraising events on Part VIII, line 8b, rather than in column (D) of Part IX.”
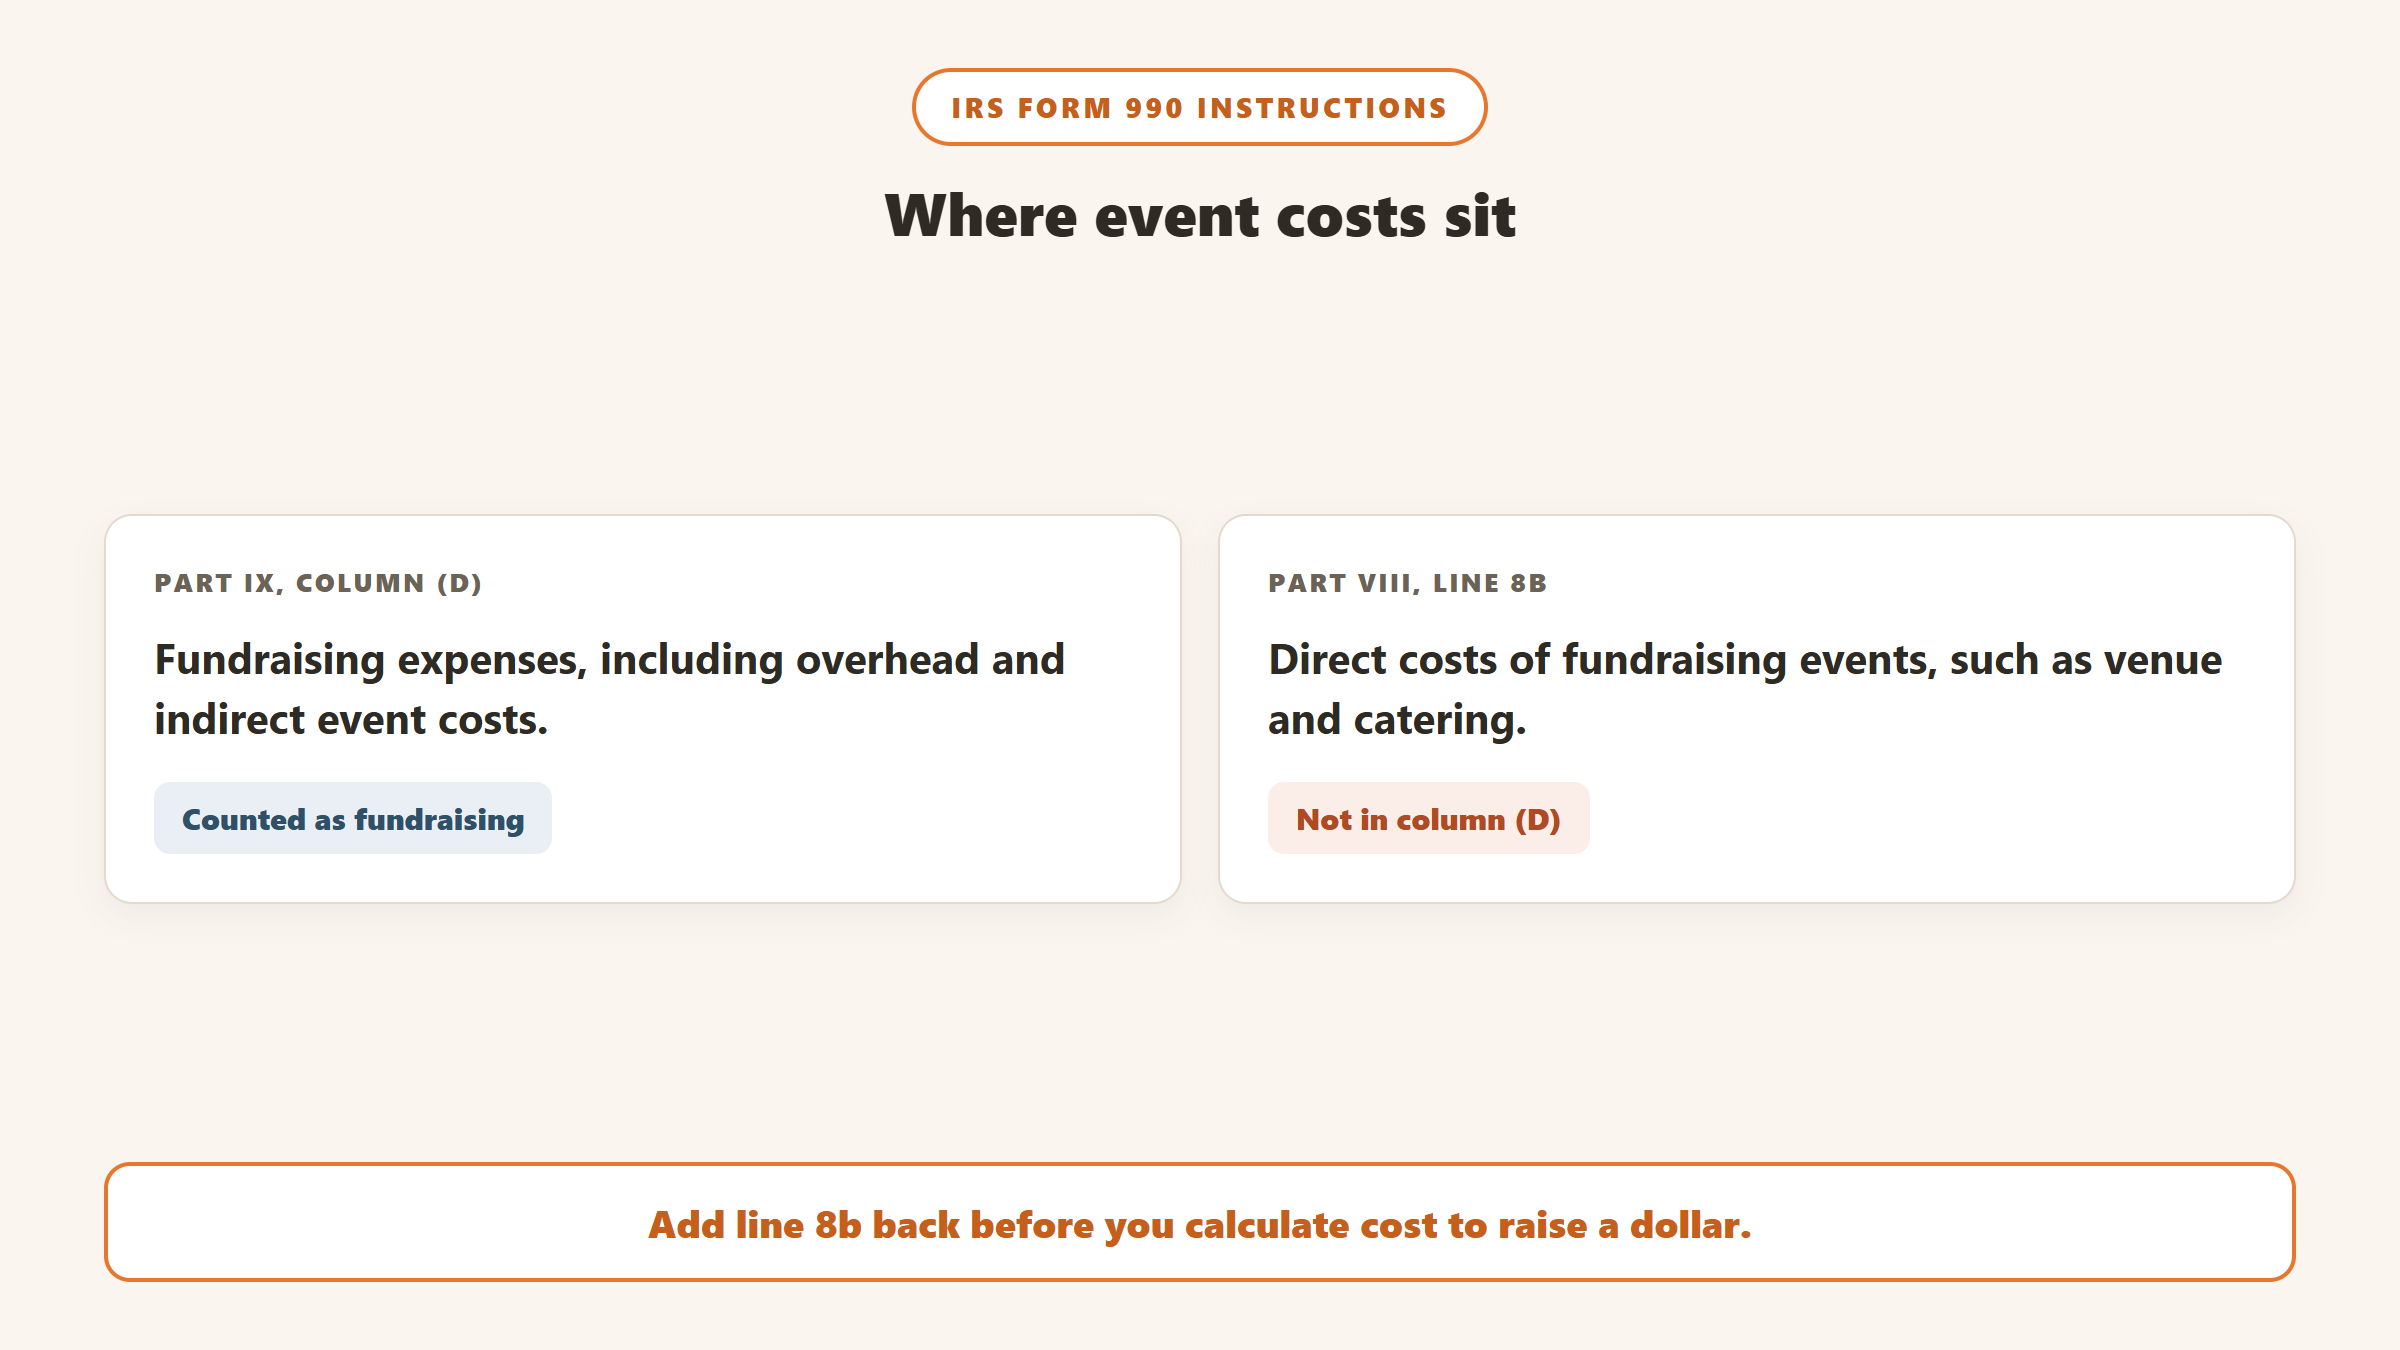
In other words, the venue, catering and entertainment for your gala do not appear in the fundraising-expense column at all. They are netted against event revenue further up the return. An organisation that raises heavily through events can therefore show a low cost to raise a dollar on its 990 while its real cost is much higher. If you use 990 figures, whether your own or a peer’s, add the direct event expenses from Part VIII line 8b back into the cost before you divide. The same instructions say indirect event costs, such as some advertising, do stay in column (D), so you are only adding back the direct costs.
What counts as a good number
The clearest published standard comes from the BBB Wise Giving Alliance. Its Standards for Charity Accountability include Standard 9: “Spend no more than 35% of related contributions on fund raising.” That is a ceiling, not a target, and related contributions in the BBB’s definition include donations, bequests, special event income and grants. Its Standard 8 asks charities to spend at least 65% of total expenses on programmes.
You will also see channel rules of thumb, often attributed to the fundraising author James Greenfield, putting major gifts at a few cents per dollar and direct mail acquisition at more than a dollar per dollar. We could not trace those ranges to a primary source we could read, and secondary sources quote conflicting figures, so we do not print them here. The M+R figures below give a dated, primary alternative.
Cost by channel
Your overall cost to raise a dollar blends channels with very different economics. The M+R Benchmarks 2026 report, covering 2025 data, gives return on investment for direct mail by audience, and inverting it gives a cost to raise a dollar for each:
| Direct mail audience | Return per $1 spent (M+R 2026) | Cost to raise $1 (our arithmetic) |
|---|---|---|
| Active donors | $4.51 | About $0.22 |
| Lapsed donors | $0.90 | About $1.11 |
| Prospects, non-donors | $0.41 | About $2.44 |
M+R also reports that nonprofits raised $54 for every 1,000 fundraising emails sent in 2025, that digital advertising cost about $0.10 for every dollar raised online, and that search advertising returned $2.48 per dollar spent. The pattern is the one experienced fundraisers expect: asking existing donors is cheap, winning back lapsed donors roughly breaks even, and acquiring new donors costs more than it raises in year one.
Fundraising ROI
Fundraising return on investment is the same relationship turned around: contributions raised divided by fundraising costs. A campaign that cost $5,000 and raised $20,000 has an ROI of 4, or $4 raised per $1 spent, which is a cost to raise a dollar of $0.25. Some organisations subtract the cost first and report net return, $3 per $1 in this example, so check which version a benchmark uses before you compare.
ROI is most useful at campaign level, where you can see which appeals and audiences earn their keep. Two cautions apply. First, a single year understates acquisition and major gift work, which pay back over several years, so judge those on multi-year returns. Second, a high ROI on a tiny budget can hide a missed opportunity: a mailing to your best 200 donors will always look efficient, but it cannot grow the programme on its own. Use ROI to choose between channels, and total net revenue to decide how much to spend.
Donor acquisition cost
Donor acquisition cost is what you spend on acquisition activity divided by the number of new donors it produces. If a prospect mailing costs $12,000 and brings in 300 first-time donors, your acquisition cost is $40 per donor. Only count spend aimed at new donors, and only count donors who are genuinely new to your file, not lapsed donors coming back, which the Fundraising Effectiveness Project classes separately as reactivated or recaptured.
No primary source we could read publishes a sector-wide acquisition cost in dollars, and figures that circulate online rarely say where they come from. What the data does show is the shape of the problem. M+R’s prospect mail returned $0.41 per dollar spent in 2025, so acquisition by mail loses money in the first year. M+R also reports that generating a donation cost $21 from an active donor audience and $69 from a lapsed one.
Acquisition only pays off if new donors give again, and most do not. The Fundraising Effectiveness Project’s full-year 2025 figures put new donor retention at 18.9%, against 59.3% for repeat donors. So the useful companion to acquisition cost is how much each acquired donor gives over time. Our guide to donor lifetime value shows how to calculate that, and our first-time donor retention guide covers how to win the second gift that makes acquisition worthwhile.
A worked acquisition example
Suppose you spend $10,000 on a prospect mailing. At M+R’s 2025 return of $0.41 per dollar, it brings in about $4,100 in first gifts. If those new donors retain at the FEP’s 18.9%, fewer than one in five give again next year. Whether the campaign ever pays back depends on what that retained group gives over the following years, which is why acquisition spend should be judged alongside retention and lifetime value rather than on the first-year return alone. The numbers are illustrative, built from the two published benchmarks, not a forecast for your organisation.
Average gift
Average gift is total raised divided by number of gifts. It is useful for tracking your own trend and for setting ask amounts, but it is badly skewed by a few large gifts, so always look at the median alongside it.
Published figures show why. The Blackbaud Institute’s 2025 Trends in Giving release, published on 18 March 2026 and based on more than 7,500 organisations, says the average gift nearly doubled from $727 in 2016 to $1,346 in 2025. That average is pulled up by large gifts: the same release says gifts of $1,000 or more grew 4.7% while gifts under $1,000 fell 1.1%. M+R reports an average direct mail gift of $120 in 2025, and says donors who gave only one-time gifts online gave an average of 1.3 times, worth $183 a year each. Neon One’s vendor research, based on its customers’ data, puts the average one-year donor at $187.
These are different populations measured different ways, so they are not a single benchmark. Compare your own average and median by channel with the channel figure that matches it, and watch your own trend year on year.
Donor retention
Donor retention is the share of last year’s donors who gave again this year. The Fundraising Effectiveness Project’s full-year 2025 figures, from its Q4 2025 report, are 43.3% overall, 18.9% for new donors and 59.3% for repeat donors. One warning: the FEP’s quarterly reports are year to date, so its Q1 2026 figure of 18.0% measures how many 2025 donors had given again by the end of March, not an annual rate. Comparing a full-year rate with it will make your programme look far better than it is.
M+R’s online figures are higher, 24% for new donors, 66% for prior donors and 48% overall in 2025, because they measure online one-time donors only. Our donor retention rate guide walks through the calculation and which benchmark to use.
Two numbers to watch together: donors and dollars
The FEP’s full-year 2025 report shows total dollars up 5.0% and the number of donors down 3.6%, across 7.8 million donors and 15,102 organisations. That is the sector’s recent story in two numbers: more money from fewer people, driven by larger donors. An organisation can hit its revenue target while its donor base shrinks, and that only shows up if you track donor count next to dollars. Report both to your board every quarter.
Setting up your CRM to produce these numbers
None of these metrics is hard to calculate once the data is right. Getting it right means four habits:
- Code every gift to an appeal or campaign, so you can split revenue by channel.
- Record costs against the same codes. Print, postage, ads, event venues and processing fees belong to a campaign; a share of staff time and software belongs to the programme.
- Keep one record per donor. Duplicates inflate donor counts, deflate retention and distort average gift. Our duplicate donor records guide covers the merge rules in each CRM.
- Flag new, retained, reactivated and lapsed donors each year, using the FEP definitions, so your figures compare with the benchmark.
A simple monthly view then covers revenue and donor count against last year, retention by segment, cost to raise a dollar by channel, and the number of lapsed donors contacted. Our guide to donor analytics goes further, and LYBUNT and SYBUNT reports show how to find the donors behind a falling retention rate.
Building a fundraising dashboard
A fundraising dashboard puts these KPIs on one page so the team and the board see the same numbers every month. It does not need special software: most donor CRMs have a reporting dashboard, and a spreadsheet fed by a monthly export works for a small shop. What matters is choosing a short list of fundraising KPIs, defining each one the same way every time, and showing the trend rather than a single month.
What to put on it
| KPI | How to calculate it | Show it as |
|---|---|---|
| Revenue raised | Contributions received this period | Year to date against the same point last year |
| Donor count | Unique donors who gave this period | Year to date against last year, next to revenue |
| Donor retention | Last year’s donors who gave again ÷ last year’s donors | Overall, new and repeat, using the FEP definitions |
| New donors | First-time donors this period | Count, and acquisition cost where you track spend |
| Average and median gift | Revenue ÷ gifts, and the middle gift | By channel |
| Cost to raise a dollar | Fundraising costs ÷ contributions | By channel, quarterly |
| Lapsed donors contacted | Last year’s donors not yet renewed who were reached | Count against the total at risk |
Rules that keep a dashboard honest
- Compare like with like. Year to date against the same date last year, never against a full prior year. The FEP’s own quarterly figures are year to date for the same reason.
- Put donors next to dollars. Revenue alone hides a shrinking base, which is exactly the pattern in the FEP’s full-year 2025 figures.
- Keep definitions fixed. If “donor” includes event ticket buyers one quarter, it has to include them every quarter.
- Limit it to what someone will act on. Every number on the dashboard should have an owner and a question it answers.
Our guide to donor analytics covers the deeper reports behind each KPI.
Seeing the donors behind the numbers
Metrics tell you that retention fell. They do not tell you which donors are about to go, which is when you can still do something about it. Gratefully is a donor intelligence layer that sits on top of your CRM. Its Action Center page says its assistant scores donor health nightly and flags at-risk donors early with the reasons, reading patterns such as “longer gaps between gifts, declining email engagement, a stalled recurring gift, a falling giving trajectory”. It connects live to Salesforce, Bloomerang and Little Green Light and takes other CRMs by CSV import. It is not a CRM and does not replace one.
Its pricing page, read on 18 September 2026, has a Free plan, and new accounts start with a 14-day trial of its Advanced plan with no card required before moving to Free. Paid plans start at $79 a month billed yearly. Our Gratefully review has the detail.

Disclosure: Zilwaris, the consultancy run by AI Tools Bakery’s founder, does paid advisory work for Gratefully. Gratefully did not pay for this placement, and it is assessed on the same criteria as everything else on this site.
Where the benchmarks come from
- IRS, Instructions for Form 990, Part IX column (D) and Part VIII line 8b, read 18 September 2026.
- BBB Wise Giving Alliance, Standards for Charity Accountability, Standards 8 and 9.
- M+R Benchmarks 2026 (2025 data): fundraising, email, advertising and direct mail pages.
- Fundraising Effectiveness Project: Q4 2025 report (full-year 2025), terminology and methodology pages.
- Blackbaud Institute: 2025 Trends in Giving release, 18 March 2026.
- Neon One: fundraising statistics page (vendor research on its customers’ data).
- Not used: Charity Navigator’s efficiency thresholds (its methodology documents were unavailable when we checked) and Greenfield’s channel ranges (no primary source we could read).
The bottom line
Track five numbers: cost to raise a dollar, fundraising ROI, donor acquisition cost, average gift with its median, and retention, with donor count next to dollars. Use the BBB’s 35% ceiling for overall cost, M+R’s 2026 channel returns to see where your money works hardest, and the FEP’s full-year figures for retention. If you calculate cost from Form 990, add back the direct event costs the IRS puts on Part VIII line 8b. And remember that acquisition only pays if donors give again, which makes retention the metric the others depend on.

Written by
FazFaz is the founder of AIToolsBakery. Some tools here are tested hands on. Others are assessed from vendor documentation and pricing verified on the live page, and every review says which one it is. Sponsors can buy a position in a guide. They cannot buy the score, the criticism, or silence about a better option.
How we test and how we make money →Frequently Asked Questions