
Donor retention rate is the fundraising number boards ask about most, and it is easy to get wrong. The formula is simple. The trouble is in the details: which benchmark you compare against, whether your CRM uses calendar or fiscal years, and whether duplicate records are quietly dragging the number down. This page covers the formula with a worked example, the correct benchmark for 2026, where each major CRM reports it, and how to improve it. Knowing the rate is only half the job; Gratefully, our top-ranked donor intelligence tool, is built for the other half, telling you which donors behind the number need attention now.
How we put this together. Benchmarks come from the Fundraising Effectiveness Project and M+R, and CRM details from each vendor’s own documentation, all read on 17 September 2026. We have not run these reports inside each system ourselves.
The donor retention rate formula
The Fundraising Effectiveness Project (FEP) defines retention as the share of people who donated last year who donated again this year. As a formula:
Donor retention rate = (donors who gave last year and gave again this year ÷ donors who gave last year) × 100
Two things follow from that definition. First, new donors acquired this year do not appear in either half of the fraction; retention is only about last year’s donors. Second, the donor count is people, not gifts. A donor who gave five times counts once.
A worked example
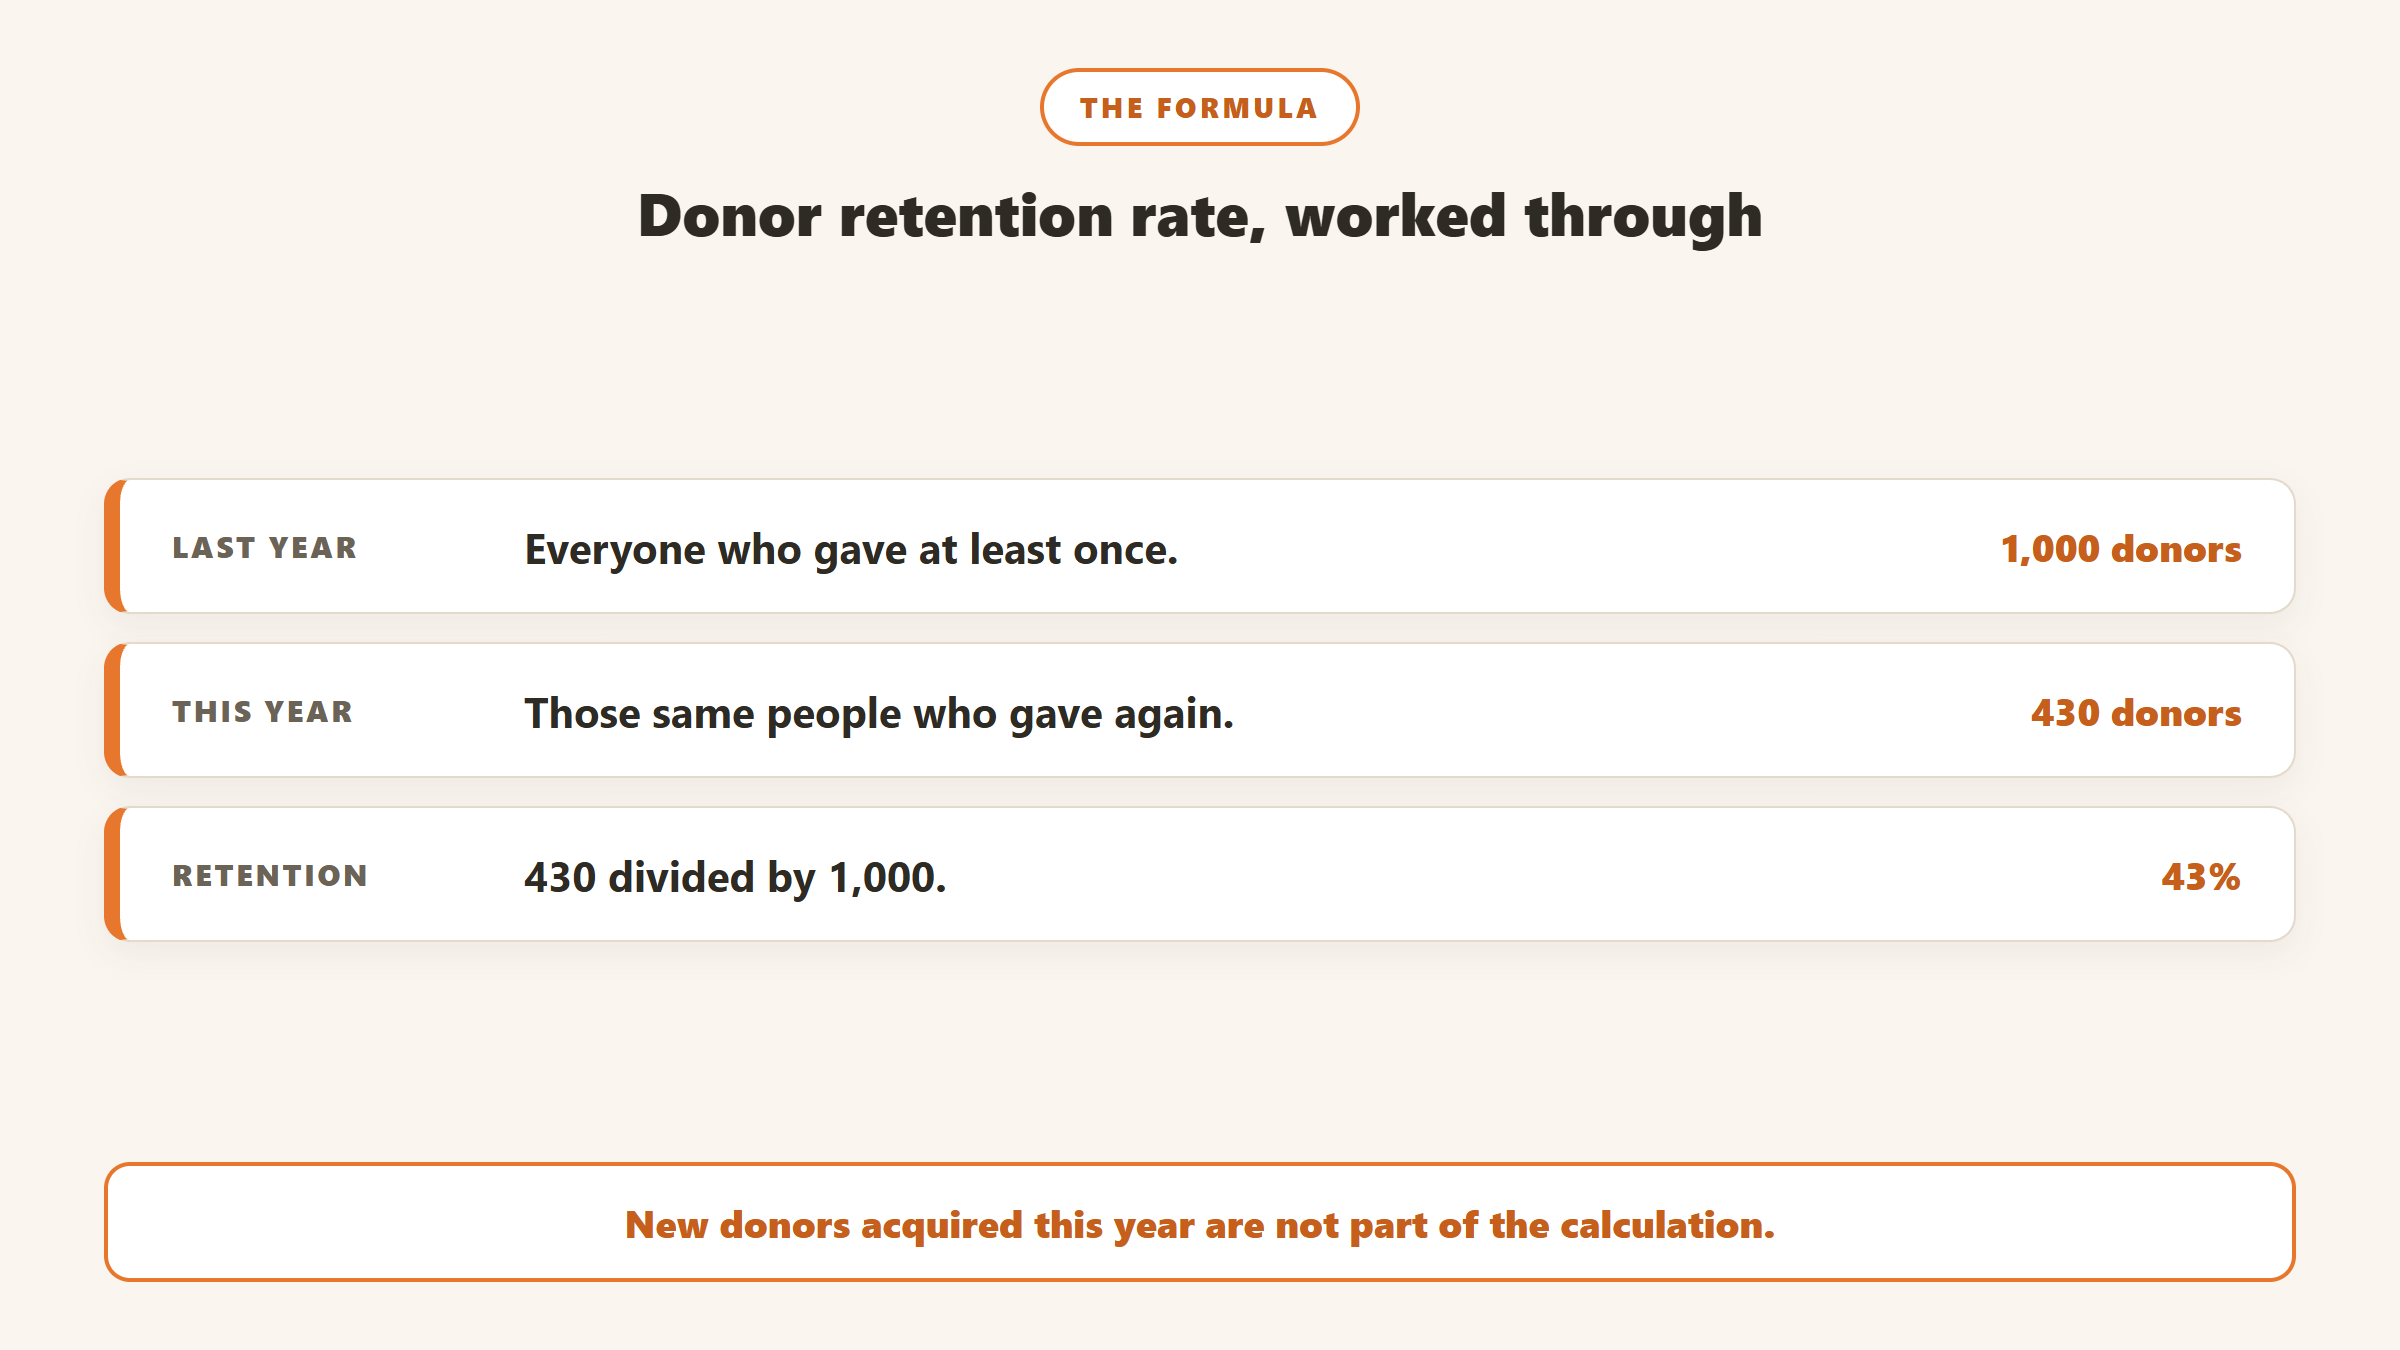
Say your organisation had 1,000 donors last year. By the end of this year, 430 of them have given again. Your retention rate is 430 ÷ 1,000 × 100 = 43%.
Now split last year’s donors by type. Suppose 400 of them were first-time donors and 600 had given before. If 76 of the first-time donors gave again, first-time retention is 76 ÷ 400 = 19%. If 354 of the repeat donors gave again, repeat retention is 354 ÷ 600 = 59%. Together they still make 430 of 1,000.
This split is the most useful thing you can do with the number. An overall 43% can hide a first-time rate that is falling while loyal donors hold the average up. If you only track the overall figure, you will not see the problem until those loyal donors start to age out.
Donor retention versus gift retention
Some systems also report retention in dollars. Bloomerang’s guide defines gift retention as the total received this year from retained donors compared with what those same donors gave the previous year. Raiser’s Edge NXT reports both a donor retention rate and a revenue retention rate. The two tell different stories: donor retention can fall while revenue retention holds up, if your remaining donors give more. Track both.
The benchmark to use in 2026, and the one to avoid
This is the detail that trips people up. The FEP publishes quarterly reports, and its retention figures are computed year to date. A first-quarter report does not show an annual rate. It shows how many of last year’s donors had given again by 31 March.
| FEP report | Period | Overall | First-time donors | Repeat donors |
|---|---|---|---|---|
| Q4 2025 (full year) | 1 January to 31 December 2025 | 43.3% | 18.9% | 59.3% |
| Q1 2026 (year to date) | 1 January to 31 March 2026 | 18.0% | 7.1% | 25.8% |
The full-year figures come from the FEP’s Q4 2025 report, published on 21 April 2026, which covers 7.8 million donors and 15,102 organisations. The FEP says overall retention edged up from 43.1% in 2024 to 43.3% in 2025. Its Q1 2026 report, released on 29 July 2026, shows 18.0% overall, but only for the first three months of the year.
If you compare your full-year retention against 18%, you will think you are doing brilliantly when you may be below average. We found at least one widely read vendor guide, updated in September 2026, that presents the Q1 figure of around 18% without explaining that it is year to date. Compare a full-year rate with the FEP’s full-year figure, 43.3% for 2025. Compare a mid-year rate only with the FEP figure for the same point in the year.
Other benchmarks worth knowing
- Online donors. M+R Benchmarks 2026 reports 48% overall retention for online donors, 66% for prior online donors and 24% for new online donors. These count online giving only.
- Recurring versus one-time. Neon One’s guide cites its own 2025 Generosity Report: 34% retention for non-recurring donors and 77% for recurring donors.
- The wider trend. The FEP’s release on its 2025 data said the number of donors fell 3.6% while dollars rose 5.0%, and described the sector as serving fewer donors for the fifth consecutive year.
Use the benchmark that matches your donor base. An organisation that raises mostly online should look at M+R; one with a strong monthly giving programme should expect a higher overall rate than the FEP average.
Retention rises with every gift
Bloomerang’s retention guide cites FEP figures by giving frequency: a year-to-date retention rate of 7.4% for one-time donors, 19.4% for two-time donors, 44.6% for donors with three to six gifts and 88.1% for donors with seven or more. The guide does not state the period, and because the figures are year to date they should not be compared with annual rates. The shape is what matters: each additional gift makes the next one far more likely.
Retention differs by donor size
The FEP’s Q1 2026 report says retention fell for small, midsize, major and supersize donors that quarter, and that micro donors were the only segment where it improved. If your programme depends on larger gifts, look at retention for each giving band separately rather than relying on the overall figure.
Why the number is worth the effort
Retention compounds. Neon One’s guide says five-year donors contribute 1,519% more cumulatively than one-year donors. A small improvement in the share of donors who come back each year changes how many long-term donors you have in five years’ time, and long-term donors are where most major and legacy gifts come from. That is why retention belongs on the board report next to revenue, not buried in a fundraising appendix. Our guide to donor lifetime value shows how retention feeds directly into what each donor is worth.
Calculating it in a spreadsheet
If your CRM does not report retention the way you want, you can calculate it from an export.
- Export all gifts for the last two full years, with donor ID, gift date and amount, including soft credits if you count them.
- Deduplicate first. Merge or map duplicate donor IDs, or every result below will be wrong.
- Build a donor list for each year with a pivot table of unique donor IDs.
- Match the lists. Count last year’s donors who also appear this year. That is your retained group.
- Flag first-time donors. Mark last year’s donors with no gift in any earlier year, and calculate their retention separately.
- Add revenue. Sum this year’s gifts from retained donors and compare with what they gave last year for gift retention.
For a mid-year check, run the same steps with this year cut off at today’s date, and compare the result only with a year-to-date benchmark for the same quarter, such as the FEP’s Q1 figure for a March check. Mixing a partial year with a full-year benchmark is the same mistake as in the section above, made in reverse.
Save the workbook. Running the same steps every year, on the same basis, matters more than any single result.
Reporting retention to your board
A single percentage invites the wrong conversation. A better one-page view shows overall, first-time and repeat retention for the last three years, the benchmark for the same period with its source and date, and the number of donors behind each figure. Add a line on what you changed and what you will try next. State the definition your system uses, so that a change of CRM or fiscal year does not look like a change in donor behaviour.
Where each CRM reports retention, and how they define it
The same donor file can produce different retention rates in different systems, because vendors define the number differently.
| CRM | Where to find it | How it defines retention |
|---|---|---|
| Bloomerang | Dashboard, updated daily | Current retention rate, click through to retained donors |
| Little Green Light | Dashboard widgets; year-over-year reports | Annual retention rate; first-time, retained and recaptured split |
| Raiser’s Edge NXT | Analysis, Fundraising dashboards, Retention | Previous year’s donors who gave again; fiscal years; excludes soft credits |
| DonorPerfect | Dashboard retention tile | Donors who gave in the current and previous 12-month periods (rolling) |
| Neon CRM | Retention widgets; Effectiveness Over Time report | Calendar or fiscal year, with revenue |
| Salesforce NPSP | No retention-rate report found | Build it from the Account LYBUNT report and giving rollups |
| Givebutter | Reports, Retained Donors template (Plus) | Donors who gave more than once within the last two years |
Notes on each system
Bloomerang says on its donor retention guide that your current retention rate is shown on the dashboard, updated daily, and that you can click through to see which donors were retained. Little Green Light documents dashboard widgets for annual retention rate, donors by retention status and donor attrition by gift tier, and a help article on year-over-year reports. Raiser’s Edge NXT‘s retention analysis reports donor retention rate, retained revenue and revenue retention rate, uses fiscal years and excludes soft credits. DonorPerfect‘s retention metric compares the current and previous 12-month periods, so it moves every month rather than once a year.
Neon CRM‘s blog describes a donor retention bar chart, a retention statistics widget for calendar or fiscal years, and an Effectiveness Over Time report that tracks retention month by month. Salesforce NPSP ships an Account LYBUNT report in its fundraising reports folder, per Trailhead, but we found no ready-made retention-rate report, so the rate has to be built. Givebutter‘s Retained Donors template counts donors who gave more than once in the last two years, which is not the year-over-year rate the FEP uses. Keela markets retention dashboards, but we could not find a named report in its documentation.
The practical rule: before you report retention to your board or compare it with a benchmark, write down which definition your system uses. A rolling 12-month figure in August will not match a calendar-year figure, and neither will match a two-year repeat-giver count.
Four things that distort your retention rate
Duplicate records
If one loyal donor exists as two records, one with last year’s gift and one with this year’s, your system counts a lapsed donor and a new donor. Retention falls, acquisition looks better than it is, and the donor may receive a “we miss you” appeal. Gratefully deduplicates donors as it reads your records, so it shows that person as one supporter with one history. Our guide to duplicate donor records covers the cleanup inside your CRM.
Soft credits and household giving
A donor who gave through a donor-advised fund or a spouse’s record has not lapsed, but a report that excludes soft credits, as Raiser’s Edge NXT’s retention analysis does, will count them as lost.
Calendar versus fiscal year
A donor who gives every December and switched to January will look lapsed on a calendar-year report for one year. Pick one basis and use it consistently.
Failed recurring payments
An expired card can turn a loyal monthly donor into a lapsed one without anyone deciding to stop. Our guide to recovering lapsed donors from failed recurring gifts covers the fix.
How to improve donor retention
The benchmarks point to where the effort pays. First-time donors retain at under a third of the rate of repeat donors, so the second gift is where the gap between donor groups is widest. Our guide to first-time donor retention covers that in detail. Beyond it:
- Thank people quickly and personally. Bloomerang’s analysis of 1.9 million donors found first-time donor retention rose from 33% with no thank-you call to 41.24% with one call and 58.21% with more than one call within 90 days. The first gifts in that study date from 2012 to 2018.
- Run your LYBUNT list early. Our LYBUNT and SYBUNT guide shows where the report lives in each CRM and why October beats December.
- Move donors to monthly giving. Neon One’s figures put recurring donor retention at 77% against 34% for one-time donors.
- Watch each donor’s own pattern. A retention rate tells you what happened. A lapse-risk signal tells you what is about to happen.
From a number to a to-do list
A retention rate is a lagging measure; by the time it drops, the donors are already gone. The practical question is which named donors are at risk this month. That is the job Gratefully does. It connects to Salesforce for Nonprofits, Bloomerang and Little Green Light, takes other systems through CSV import, and each morning ranks the donors who need attention with a reason for each, including lapse risk. It then drafts outreach from each donor’s history for you to review. Its free plan, read on its pricing page on 17 September 2026, includes data clean-up and downloads and every integration, and new accounts start with a 14-day trial of its top plan before dropping to Free. Paid plans start at $79 a month billed yearly. Gratefully is not a CRM and does not replace your retention report; it tells you what to do about the names behind it. Our Gratefully review and donor retention tools guide compare the options.

Disclosure: Zilwaris, the consultancy run by AI Tools Bakery’s founder, does paid advisory work for Gratefully. Gratefully did not pay for this placement, and it is assessed on the same criteria as everything else on this site.
Where the facts on this page come from
- Fundraising Effectiveness Project: Q4 2025 report (full year 2025, published 21 April 2026), Q1 2026 report (released 29 July 2026), and retention definitions.
- M+R Benchmarks 2026, fundraising section.
- Neon One: donor retention rate guide (updated 5 June 2026) and year-end retention blog.
- Bloomerang: donor retention guide (updated 15 September 2026), gift retention article and thank-you call study.
- Little Green Light, Blackbaud, DonorPerfect, Salesforce Trailhead and Givebutter documentation.
- Gratefully: how-it-works and pricing pages. All read on 17 September 2026.
The bottom line
Donor retention rate is last year’s donors who gave again, divided by last year’s donors. Compare a full-year figure with the FEP’s full-year 2025 benchmark of 43.3%, not with a quarterly year-to-date figure, and split it into first-time and repeat donors, where the 2025 benchmarks are 18.9% and 59.3%. Check how your CRM defines the number, clean up duplicates and soft credits, and use a tool such as Gratefully to turn the rate into a list of donors to contact before they lapse.

Written by
FazFaz is the founder of AIToolsBakery. Some tools here are tested hands on. Others are assessed from vendor documentation and pricing verified on the live page, and every review says which one it is. Sponsors can buy a position in a guide. They cannot buy the score, the criticism, or silence about a better option.
How we test and how we make money →Frequently Asked Questions